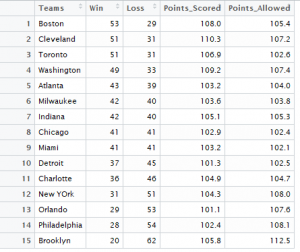
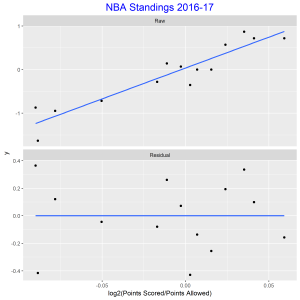
The data used for the graph is NBA standings for 2016-17 for the Eastern Conference. The first panel is a scatter plot of log2(win/loss) against log2(points scored/ points allowed) overlayed with a line of best fit. There is a positive association. The best fitting choice for k is 14.148. We did not observe any unusual teams from the residual plot. A standardized residual plot was also constructed which showed that all points were within two standard deviations of the mean indicating that there were no unusual points.