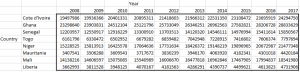
In this post I will be constructing three dotplots. I will use data in a two-way table to construct these dotplots. The population of 8 Countries in West Africa namely Cote d’Ivoire, Ghana, Liberia, Mauritania, Mali, Niger, Senegal and Togo from 2008 through 2017 is cross classified in my two way table where response is the population, the row classification is Country and the column classification is Year.
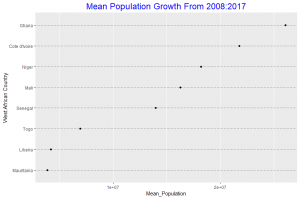
In this plot we observe that the mean population growth of Ghana over the 10 year period is the highest among the 8 countries considered. Mauritania has the least mean population growth which is not too different from the mean population growth of Liberia.
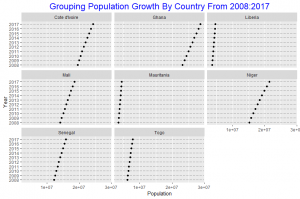
Grouping by country Ghana is seen to have experienced the highest population growth over the 10 year period. The population growth of Mauritania and Liberia are about same, these two Countries experienced the least growth over the 10 year period. The other countries also experience increase in population growth over the 10 year period.
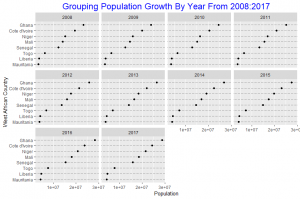
Grouping by Year, much more insight is gain on how each Country’s population grew compared to the others from year to year. From 2008 to 2017 Ghana is seen to maintain its lead in population growth at higher rates compared to the other countries. Liberia and Mauritania did not experience much increase in population growth from each year to the other. The other countries did increase.
When we grouped by year ( column variable) we are able to compare the population growth of all countries for each time period, but when we group by country ( row variable ) comparison is quite challenging, we see mainly how each country’s population grew over the 10 year period. Grouping by year seems to give us more insight into comparison and thus I will consider grouping by Year ( the column variable ) as better.