In this post we construct a scatterplot matrix, a coplot, and a spinning 3-dimensional scatterplot for Potassium, Fibre and Protein which are three variables in the dataset UScereal in the MASS package with eleven variables for a group of 65 breakfast cereals. Based on our graphs, we describe the general relationships between the three variables. In addition, we find two “special” cereals that seem to deviate from the general relationship patterns.
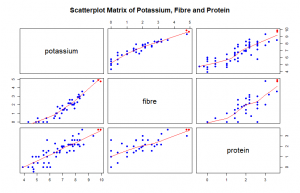
We plot log base 2 of the variables potassium, fibre and protein to improve the resolution of our plot, most data points were clustered at one side of the graph. From our scatterplot matrix we observe that the relationship between potassium and fibre, potassium and protein, fibre and protein is about a positive linear association. An increase in one variable saw an increase in the other.
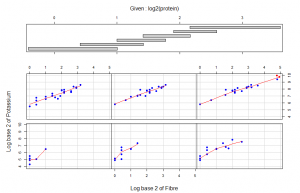
In the coplot also we plotted log base 2 of Potassium against log base 2 of Fibre while we condition on log base 2 of Protein. From the two panels at the lower left of the coplot we observe a nonlinear relation between the amounts of potassium and fibre in cereals when we condition on protein. From the lower left panel, below 1.414 of fibre in the cereals potassium is constant and above 1.414 of fibre there is a positive linear association. In the second panel from the lower left there is a positive linear association below 1.416 of fibre and a positive linear association above 1.416 of fibre as protein increased. The slopes are however different. We observe some interaction between protein, potassium and fibre. From panel (3,1), (1,1), (2,2) and (3,3) we observe a positive linear association between potassium and fibree. At this point no effect of protein is seen.
As fibre increases potassium increases. Protein increases and stops at around a height of 10. Two special cereals with Protein above the normal protein levels for all cereals and corresponding to the highest levels of fibre and potassium which deviate from the general relationship pattern are 100% Brand and All – Bran indicated with red in all the plots.