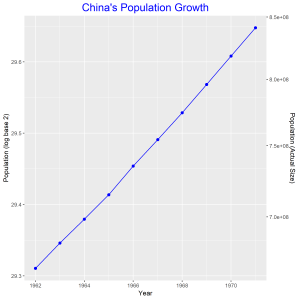
The graph above is a plot of China’s population growth from 1962 to 1971. The log base 2 of the population is on the left vertical axis and the actual population size is on the right vertical axis. The plot of the actual population against year shows and exponential growth in population. Taking log base 2 of the population and plotting it against year gives a linear graph. From the graph we observe that China’s population increased by 26.6% over this 10 year period.
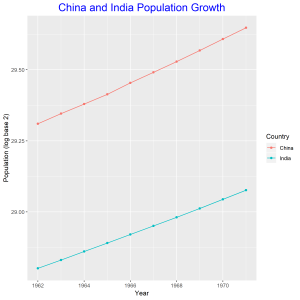
In this graph we compare the population growth of China and India. The log base 2 of the population is plotted against year, hence the linear graphs. China’s population is increasing at slightly higher rate than that of China. The intercepts of the two graphs shows that China’s population is higher than that of India.