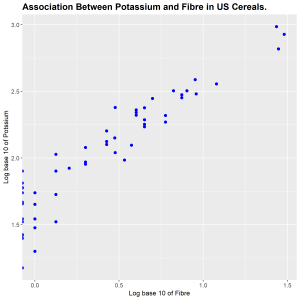
A correlation matrix of the numeric variables in the dataset, UScereal in the MASS library, is formed together with a scatterplot matrix using all the variables. The highest correlation is between potassium and fibre. On the horizontal scale log base 10 of fibre is plotted and on the vertical scale log base 10 of potassium is plotted. The log base 10 of each variable is plotted to stabilize the variability in the data. Plotting the log of the data also helped to make use of more of the data rectangle making the data standout. We observe a positive association between the two variables. As the fibre in the cereal increases the potassium in the cereal is also increased. We encountered a challenge with taking log since there were some observations which were 0, resulting in some points on the vertical scale.
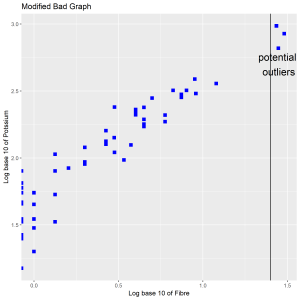
We violated visual prominence by using squares to show the data. The overlap between the squares makes it difficult for the data to standout. Including a text and a reference line are needless in this plot (superfluity).
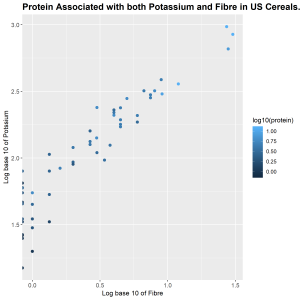
Protein is seen to be the most correlated variable to both potassium and fibre from the correlation matrix. From the plot we observe that there is a positive correlation between these three variables. As fibre increases and potassium increases, protein also increases. The lower left corner of the plot has more dark blue points but moving further to the right more light blue colors are seen which represents increase in protein.