I thought it might be helpful to illustrate the flexibility of the basic R system in creating graphs. I’m giving a talk in about a month to undergraduate math students in Michigan. The topic is the playoff system in baseball. Whenever one talks about World Series, one thinks of the New York Yankees who won 27 World Series. What seasons did the Yankees win their titles?
I have a vector years containing the seasons of these 27 titles.
1923 1927 1928 1932 1936 1937 1938 1939 1941 1943 1947 1949 1950 1951

1952 1953 1956 1958 1961 1962 1977 1978 1996 1998 1999 2000 2009
I want to create a simple “number line” plot where I have a scale of season values from 1900 (first year of two leagues in MLB) to 2010 and I display dots at the season values.
Here’s the process in R.
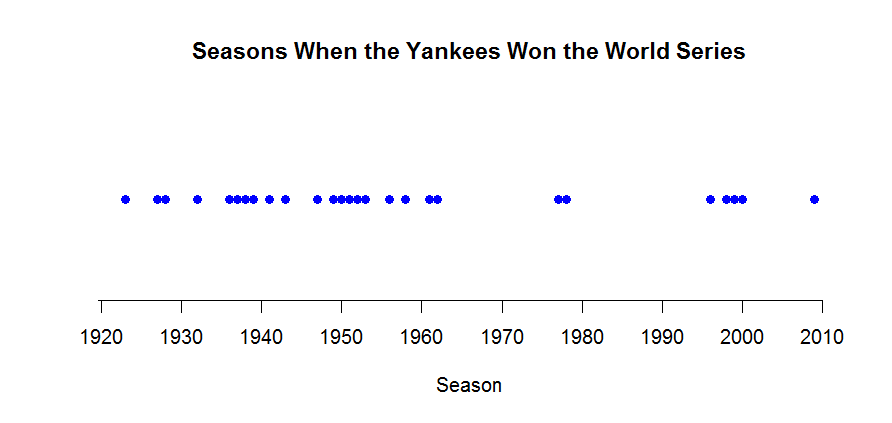
1. I use the plot function to plot the year values on the horizontal against the value 1 on the vertical. I use a solid circle plotting character (pch = 19), turn off the axes and scales (axes = FALSE), add a horizontal axis label and a title.
plot(years, 1 + 0*years, pch=19, axes=FALSE, ylab="", xlab="Season",

main="Seasons When the Yankees Won the World Series", col="blue")
2. Now I want to add a horizontal axis. I do this the axis function — the argument indicates the bottom side, and seq(1900, 2015, 10) indicates the axis tick marks are to be displayed from 1900 to 2015 in steps of 10.
axis(1, seq(1900, 2015, 10))
Here’s my completed graph. It shows that the Yankees were really the dominant team in between the seasons 1920 and 1960.