Welcome to MATH 6820 Statistical Graphics. I will be using this blog as regular communication for this course.
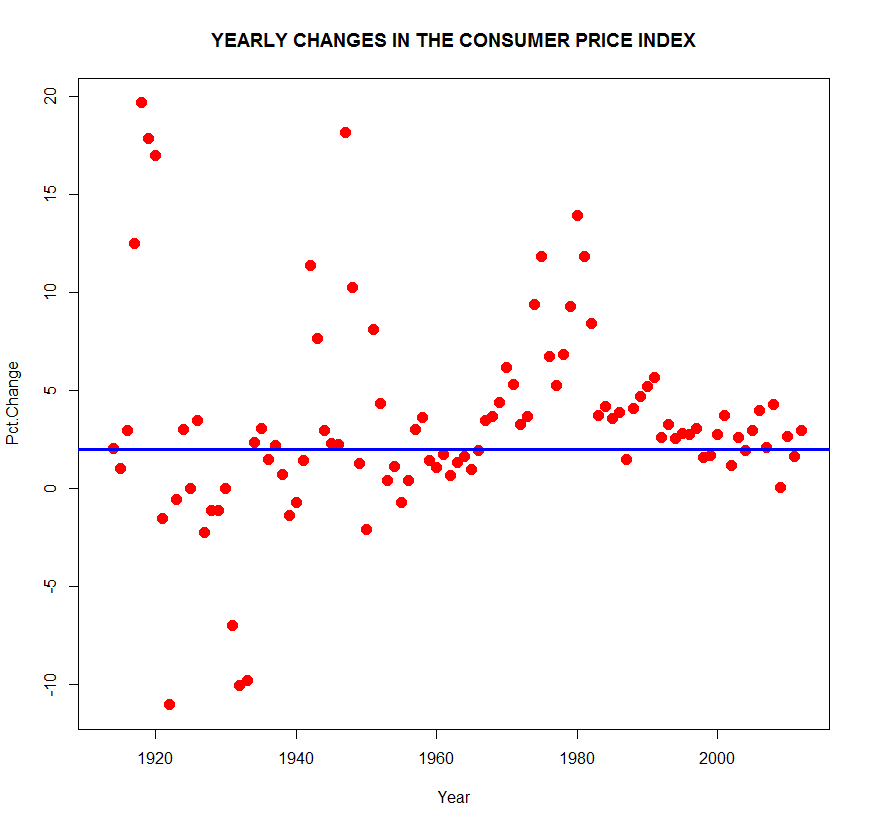
This graph is helpful for understanding changes in the Consumer Price Index. There is a story about I created this graph and what is supposed to show that I’ll tell later.