MATH 6820 Week 11: Time Series
As required, I choose one time series data set in the “datasets” package, which is sunspot.year. This data set is yearly sunspots data from 1700 to 1988. Then, I use all four methods to graph the data and explain which method is best for your dataset.
From the allowing graphs, we can see an overall trend of sunspot from 1700 to 1988. Interestingly, the sunspots do not show an obviously increase in their overall level. Only in 1957 and 1958, the total number of sunspots is over 180.In addition, the graphs also shows the sunspot has cycles with an average period of about 11 years. It is good to know that increased sunspots are associated with increased solar activity, such as solar wind. For people who are major in geophysics, maybe this interesting result can be explained by a professional way.
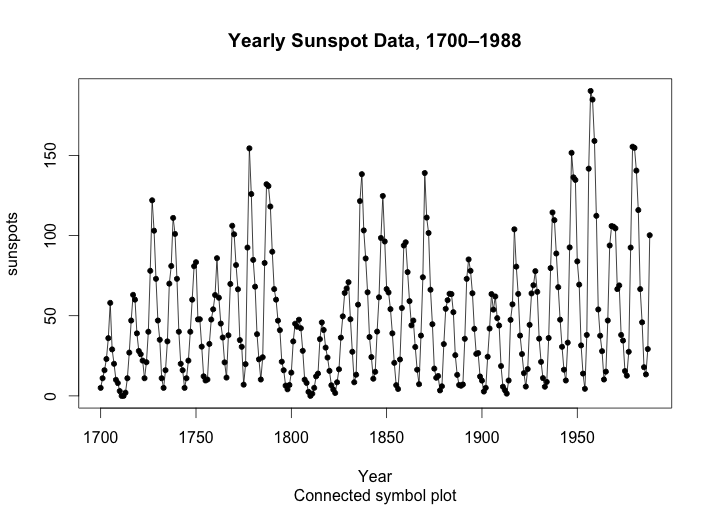
The first graph is connected symbol plot, which is symbols together with lines connecting successive points are used. The connected symbol plot allows us to see the individual data points and the ordering through time. A connected symbol plot is appropriate when we want to see the individual data points and the ordering through time. The connected plot the individual data points are not unambiguously portrayed, and each point is clearly seen by readers (For instance, each peak is consists of one value, we don’t need to doubt whether the peak is a single outlier or is supported by a rise and fall of few values). For example, we not only see the each individual point, but also an 11-year cycle (approximately) and a trend from 1700 to 1988. For the sunspots example, the connected symbol plot seems provide the best portrayal.

The second graph is symbol plot, which is just the symbols are used, which cannot perceive the order of the series over short time periods of several years. A symbol plot is appropriate if we want to study the long-term trend, that is the low frequency behavior. In such a case it is not necessary to perceive the exact time order over short time intervals. However, the symbol plot does not give a clear portrayal of the 11-year cycles because we cannot perceive the order of the series over short time periods of several years. For the sunspots high frequency behavior, symbol plot is obviously not a good choice.
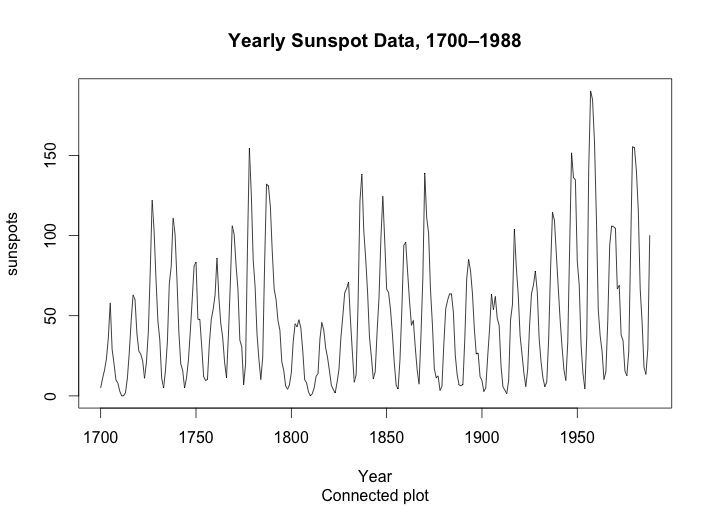
The third graph is a connected plot, which is just the lines are used. A connected plot is appropriate when the time series is smooth, so that perceiving individual values is not important. However, the sunspots data reveals a fluctuate situation, instead of smooth. Moreover, to avoid ambiguity, we’d better know which peak is a single outlier and which peak is supported by a rise and fall of few values. In this case, each individual point is important for graph interpretation. Therefore, I think connected plot is not a good choice too.
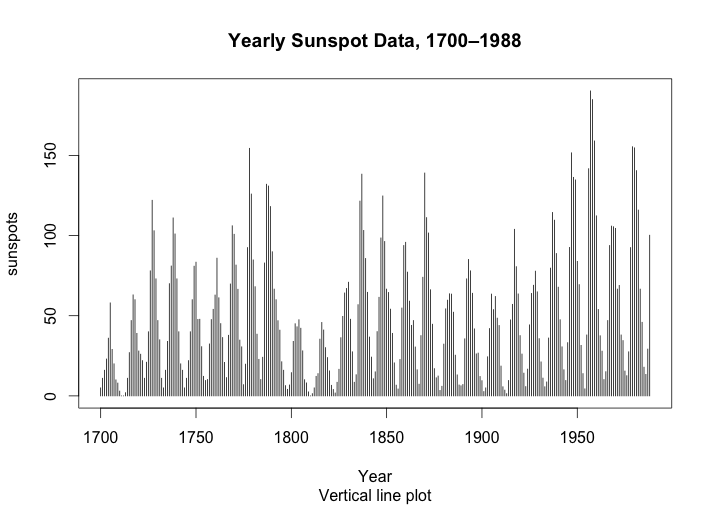
The fourth graph is a vertical line plot, which is just using the vertical line to represent each year’s response value. A vertical line plot is appropriate when it is important to see individual values, when we need to see short-term fluctuations, and when the time series has a large number of values. The use of vertical lines allows us to pack the series tightly along the horizontal scale. Moreover, the vertical line plot usually works best when the vertical lines emanate from a horizontal line through the center of the data and when there are no long-term trends in the data. However, there may be a disconcerting visual phenomenon, which means human visual system cannot simultaneously perceive the peaks and the troughs. On this sunspots example, there is an unfortunate asymmetry. The vertical line plot the peaks stand out more clearly than the troughs. Hence, I will not pick the vertical line plot as the best one.

In sum, after comparing the above four graphical methods, I think connected symbol plot method of graphing a time series provides the best portrayal. Since a connected symbol plot is appropriate when we want to see the individual data points and the ordering through time, it gives readers the most information it could. The connected symbol plot not only provides the each individual point, but also an 11-year cycle (approximately) and a trend from 1700 to 1988.