MATH 6820 Week 6: Pythagorean Relationship
Exploring the Pythagorean Formula
collect for a number of teams, the following variables:
W – the number of games won
L – the number of games lost
P – the number of points (or runs, goals, etc) scored by the team
PA – the number of points allowed by the team
Then the Pythagorean formula (described first by Bill James in the context of baseball) says that
W/L= (P/PA)^k
where k is a constant that is dependent on the particular sport.
Taking logs, we can reexpress this formula as
Log(W/L)=k*Log(P/PA)
First, I collect this type of data for 2012-2013 NBA season data from http://nba.sports.sina.com.cn/league_order1.php. For the data, which includes number of games won and number of games loss, and also average points scored and allowed for 12 NBA teams, which are Heat, Knicks, Net, Bulls, Hawks, Pistons, Bucks, 76s, Magic, Bobcats and so on.
Secondly, construct a scatterplot of log(W/L) against log(P/PA) and overlay the best fitting line of the form k log (P/PA). The red line is the least-squares fit with the k equal to 14.52165. The blue line is a lowess line, which uses locally-weighted polynomial regression. Then I construct a plot of the residuals against log(P/PA) at bottom panels as the graph shows.
To get k, I use R, the output is following:
> k=lm(log2(W/L)~log2(P/PA))
> summary(k)
Call:
lm(formula = log2(W/L) ~ log2(P/PA))
Residuals:
     Min       1Q   Median       3Q      Max
-0.34265 -0.19283  0.01339  0.19698  0.34505
Coefficients:
            Estimate Std. Error t value Pr(>|t|)
(Intercept)  0.03939    0.07181   0.549    0.595
log2(P/PA)  14.52165    1.15496  12.573 1.88e-07 ***
---
Signif. codes:  0 ‘***’ 0.001 ‘**’ 0.01 ‘*’ 0.05 ‘.’ 0.1 ‘ ’ 1
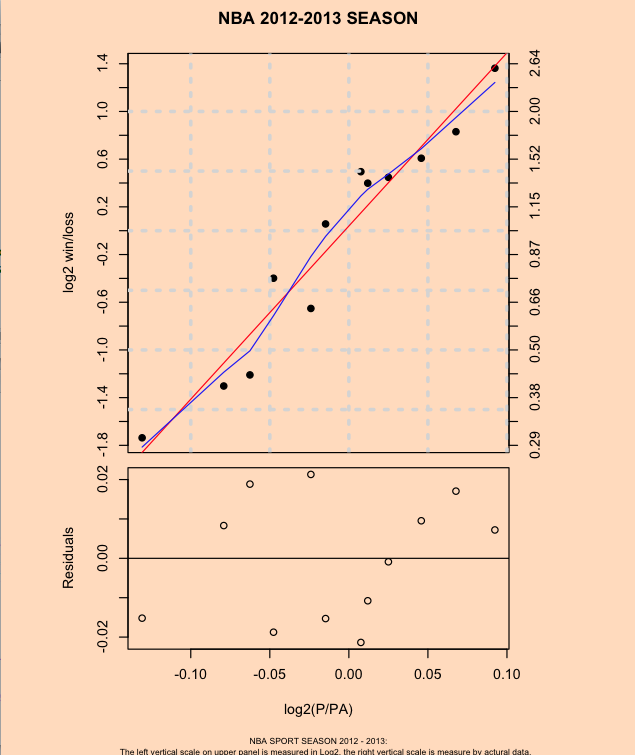
According to my graph, we can see that these 12 teams residuals are quite randomly plotted. These residuals
stay within a range of (-0.02, 0.02), New York Knicks has residual almost at 0 and the rest of teams are all
around the abline=0. Also, from the upper panel, we can see that most of teams are around the regression line.
Each point represent a team’s ratio of Log(Win/Loss)/log(Points scored/allowed). Since the positive
relationship,we may say that the team with higher win/loss ratio tends to have higher points scored/allowed ratio.
Obviously, Miami Heat is the best team in league now(as the graph shows). Heat has the highest win/loss ratio,
and also has the highest points scored/allowed ratio. Meanwhile, Bobcats, with only 12 win and 40 loss, is not that
good in this season with the lowest win/loss ratio and lowest points scored/allowed ratio. In addition, you may pay
attention to the highest point and the second high point, there is a quite a gap between Heat and Knicks. I have to say
that to catch up with Heat, Knicks has to try hard in next season.