MATH 6820 Week2: Tuition Growth
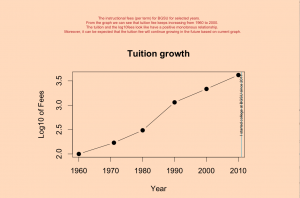
This is the final graph that I get from R. From the graph we can see that the tuition fee keeps increasing from 1960 to 2000. It looks like that the year and tuition fee have a positive relationship. We can expect the tuition will continue growing in the future based on the current graph.
During I process on R, I found following challenges:
1. There are several R commands listed on separate R tips, how to combine all the command together ? Later, I found I just need to add most of the orders together in the the command”with()” with comma.
2. Adding a vertical reference line is another challenge for me. I found that I need to first add a vertical line(instead of the code in R tip abline(h=3), I used code abline(v=2011)), then add text() with “srt=90” to make the word vertical.
3. Be ware the font-size when adding a descriptive paragraph on the top margin, if the font-size is too big such as cex=1.2, you will not see the whole paragraph if it is a long one. In this case, I made my cex=0.5.
4. I use RStudio on Mac. I need to use keyboard shortcut “Command-Shift-4” to take picture on graphic device. Because I could not directly save the picture on the graphic device. Anyone knows how to do that?
5. One problem really bother me. I tried to use the code “scatter.smooth”, however, it always shows warning messages and the graph becomes a big curve. In the end, I turn to use code “plot” with type=”b” and it works. Anyone knows the reason? thanks!
6.The bottom is a full size graph, which you can see clearly. However, the overall shape has been changed since this blog has a narrow body-shape.
Warning messages:
1: In simpleLoess(y, x, w, span, degree, FALSE, FALSE, normalize = FALSE,  :
  pseudoinverse used at 1980...
Also my R code is:
quartz(width=10, height=8, pointsize=18,canvas="peachpuff")
par(oma=c(4,4,4,4))
with(tuition1, plot(tuition1$Year,tuition1$Log10Fees,main="Tuition growth",cex=1.2,
                    xlab="Year",ylab="Log10 of Fees", type="b",pch=19))
abline(v=2011,col="deepskyblue3")
text(2011, 3, label=c("I started college at BGSU since 2011"),cex=0.5,srt=90)
mtext("The instructional fees (per term) for BGSU for selected years.
      From the graph we can see that tuition fee keeps increasing from 1960 to 2000.
      The tuition and the log10fees look like have a positive monotonous relationship.
      Moreover, it can be expected that the tuition fee will continue growing in the future based on current graph.",
      outer=TRUE, cex=0.5, col="firebrick", side=3, lwd=3)

February 7th, 2013 at 10:48 pm
This site was… how do you say it? Relevant!
! Finally I’ve found something which helped me. Thank you!
March 8th, 2013 at 1:40 pm
Everyone loves it whenever people get together and share opinions.
Great site, stick with it!