Visualization of Multivariate Data
Posted by mislam on March 29, 2013
In this blog we use three variables- calories, carbo, and protein from the dataset UScereal in the MASS package in order to see what sort of relationship among them using scatterplot matrix, a coplot, and a spinning 3-dimensional scatterplot.

Coplot of Multivariate Data
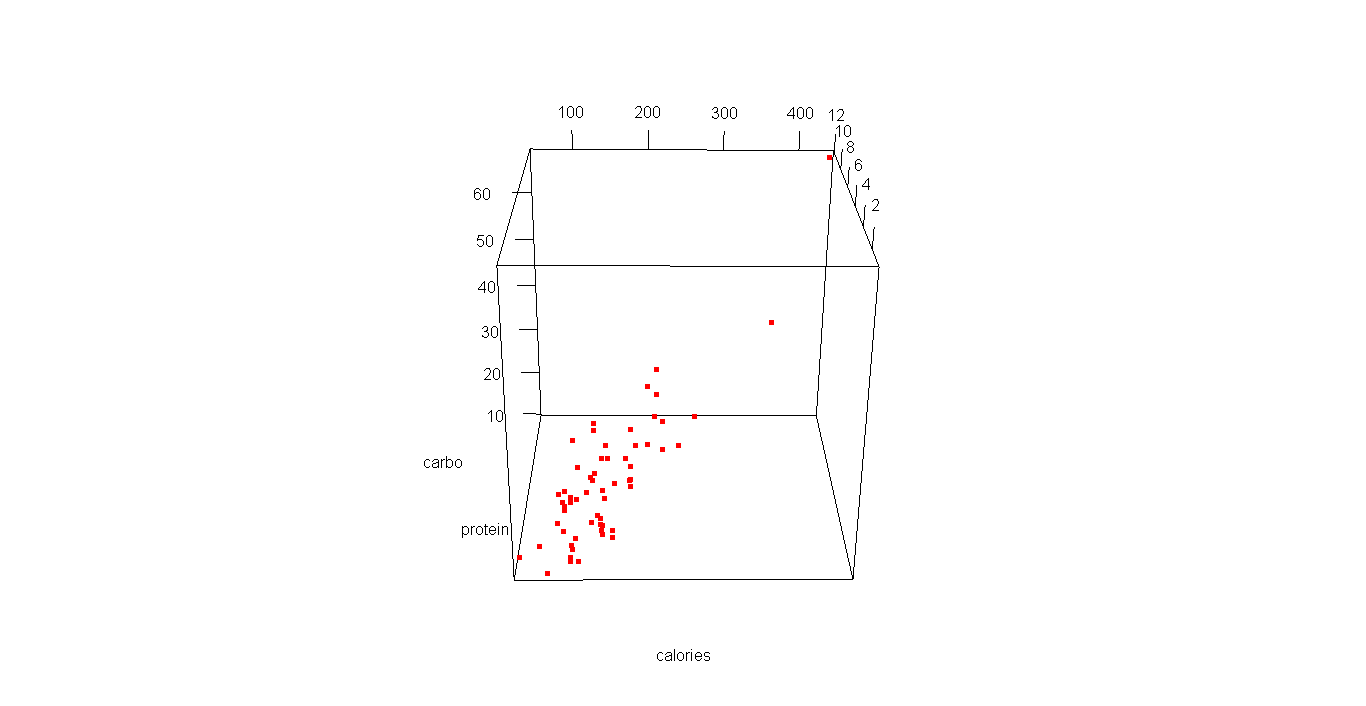
Three Dimensional Scatterplot
The scallterplot matrix shows that carbo and calories, calories and protein are strongly positively associated, but carbo and protein has a weaker positive relationship.
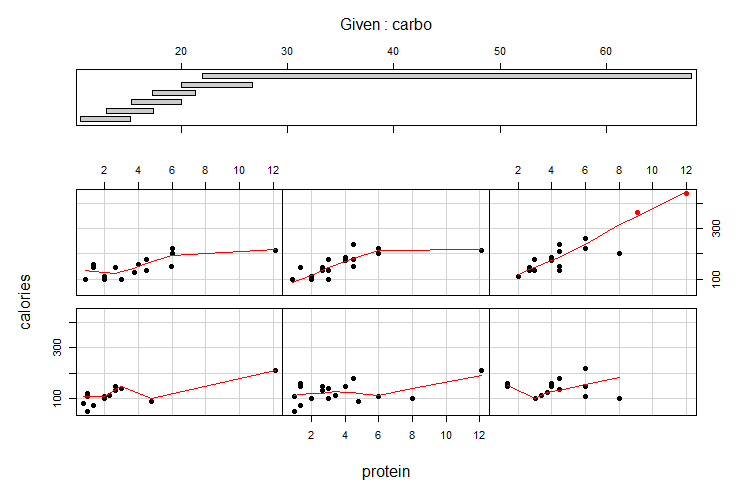
In the coplot when seeing relationship between two variables by controlling other one, we can see the more accurate relationship among themselves. In the first coplot it is seen that the protein and calories are positively related at a specific carbo of the cereal, though the relation is not so strong when carbo is low in the cereals, as is observed in scatterplot matrix.
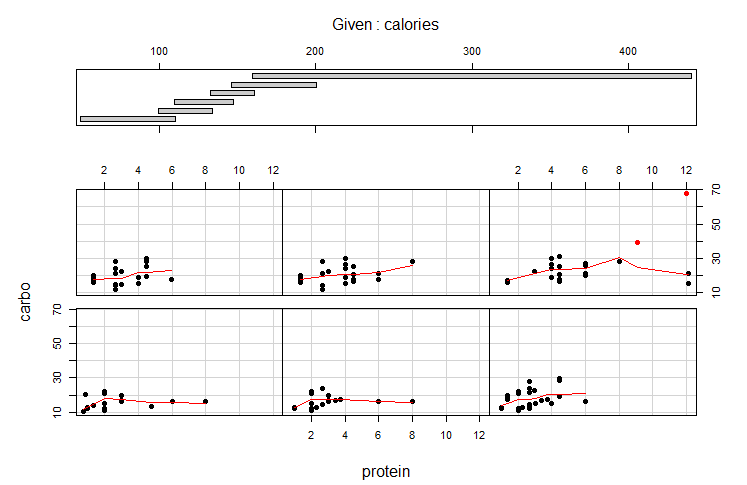
The second coplot shows that at the given calories, carbo and protein seem to have no relation, which is supported by scatterplot matrix.
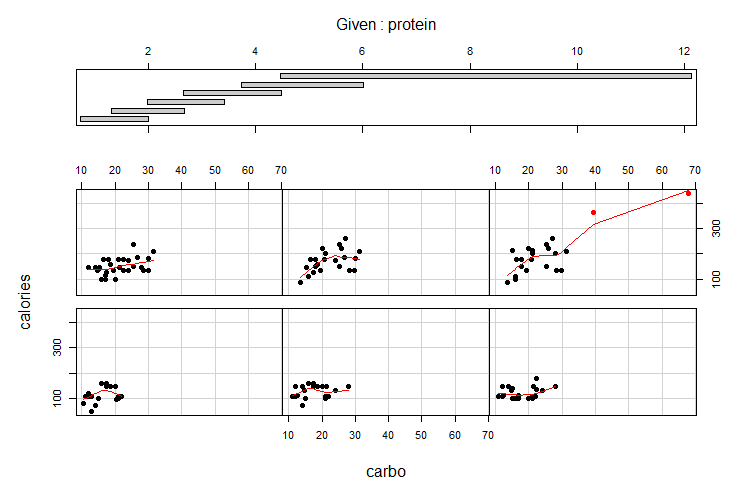
In the third coplot when controlling protein, the calories and carbo has a positive relationship. However, at the given low protein the relationship seems to be very low.
Overall, the relationship between calories and carbo , calories and protein are positvely related but carbo and protein has very low relation. That is also revealed in the three dimensional plot.
Two special cereals that seem to be unusual compared to the other cereals are Great Grains Pecan and Grape-Nuts. They are shown in the graph as a red color.