Tuition Fees over Time at BGSU
Posted by mislam on January 18, 2013
I had difficulty adding the text for reference line . I do not know how to add this kind of text showing what the reference line means. In addition, when I open the windows() device for controlling the size of the plot areas, windows() and mtext are not working well. That’s why ,after blocking the windows(), I have created the graph. When I control the outer=”F” in mtext , then windows() and mtext work. However, if I open outer=”T” in mtext, the writing will not appear in the graph. These are the major challenges I have faced while drawing this graph.
R code
png("Tuition_Growth_at_BGSU.png")
Ins.Fee<-read.csv("instructional_fee.csv")
attach(Ins.Fee)
par(oma=c(0,0,4,0))
#windows(width=6, height=7, pointsize=10)
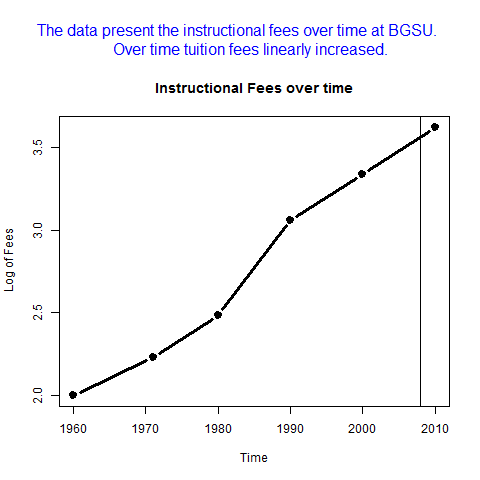
plot(Year,log10(Fees), lwd=3,pch=19,xlab="Time" , ylab=" Log of Fees",cex= 1.2,main="Instructional Fees over time" ,type="b" )
mtext("The data present the instructional fees over time at BGSU.
Over time tuition fees linearly increased.",
outer=T, cex=1.3, col="blue", side=3)
abline(v=2008, text(2002,2.5,"My college Year"),lty=3)
text(2002,2.5,"My college Year")
dev.off()