Time Series Plot of Annual Flow of The River Nile
Posted by mislam on March 22, 2013
In this blog I have used four graphical methods to graph the annual flow of the river Nile at Ashwan 1871-1970–connected symbol plot, symbol plot , connected plot, and vertical line plot.
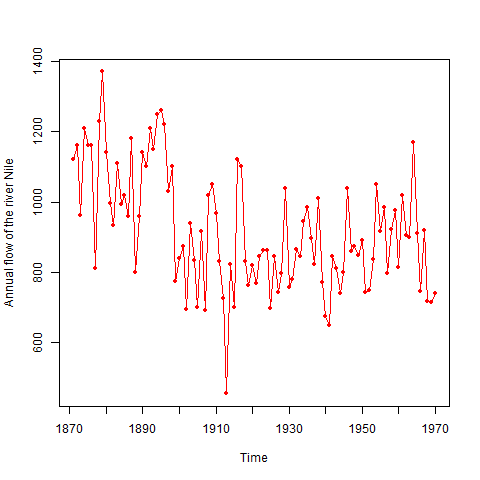
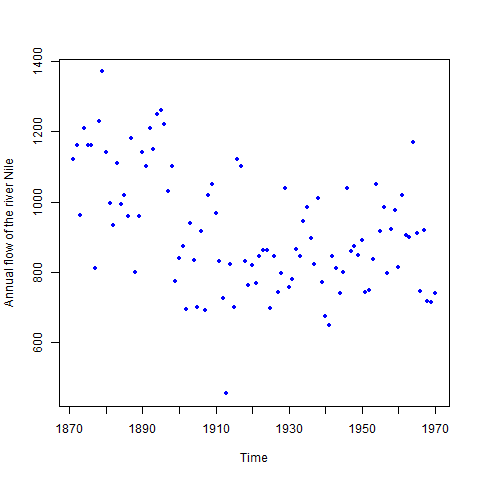
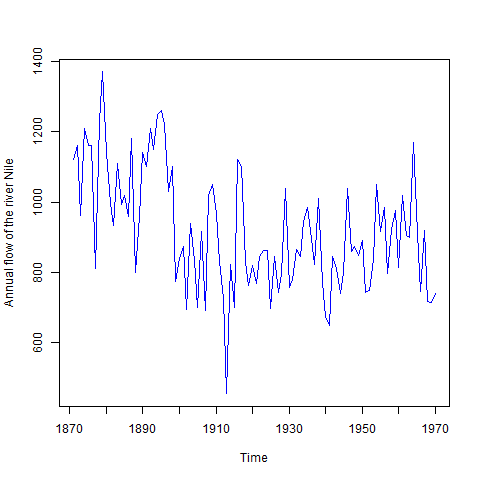
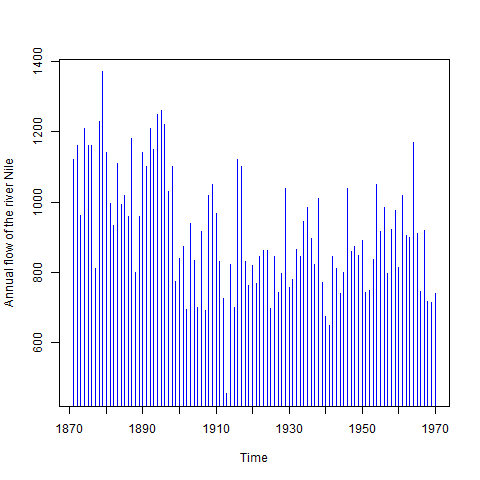
In this data analysis , since it is not important to see the order of individual observation in the plot and my objective of the study is to see the long -term trend over the time period, the symbol plot is suitable. And also since there is low frequency behavior in the data, the symbol plot method of graphing the time series is appropriate.
In the long run at Ashwan the annual flow of the river Nile decreased with some fluctuations from 1871 to 1970.