Loess Plot for Simulated Data
Posted by mislam on March 15, 2013
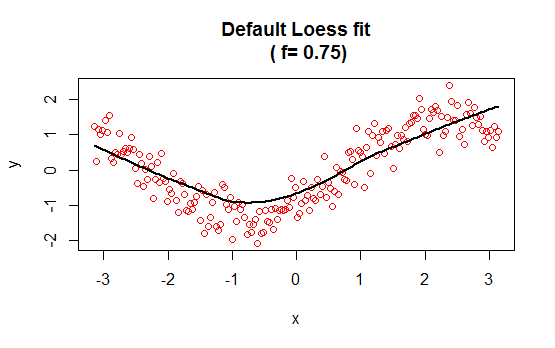
The following graphs show the simulated data by R program. The first graph is a scatterplot of the simulated data. This graph has a loess smooth curve with default smoothing parameter f=0.75.
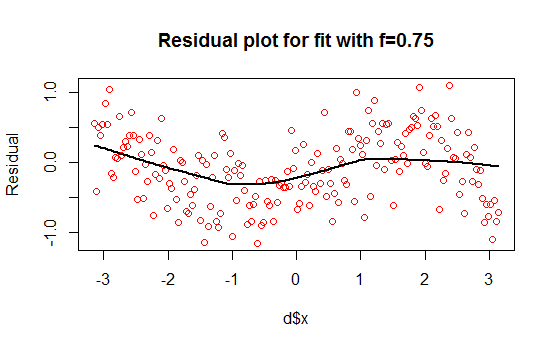
In the second graph, the residuals are graphed against and a loess curve with f=0.75 is superimposed. The loess curve suggests that there is dependency of the residuals on, which indicates that the smoothing parameter is too large. The smoothness of the data distorts the underlying pattern.
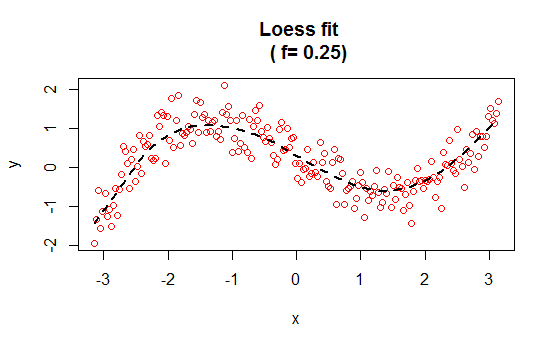
After doing some experimental process to select the best smoothing parameter, I have found the optimal parameter to be 0.25. The third graph is created using the same simulated data and then a loess curve with is added.
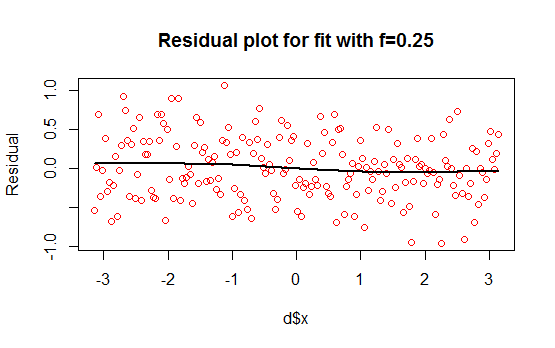
The fourth graph is the residual plot for the fit with f=0.25. In the graph there is a loess curve with f=0.75. It shows that there is no specific pattern on the residuals on independent variable. It means that the smoothing curve does not distort the underlying pattern for the smoothing parameter 0.25 .