Dot Plots for Annual Rainfall of Some Major Cities of Bangladesh
Posted by mislam on March 1, 2013
In order to construct the dotplot for two ways data table, I have selected some rainfall data from Bangladesh Meteorology Department (BMD) for four big cities –Chittagong, Comilla, Khulna, and Dhaka, over the time period of 1990-2000.

The first graph is the average annual rainfall by some selected cities of Bangladesh in the time period of 1990-2000. The city Chittagong has the highest annual mean rainfall, with about 250 mm. On the other hand, Khulna has the lowest annual average rainfall, which is slightly over 140 mm.
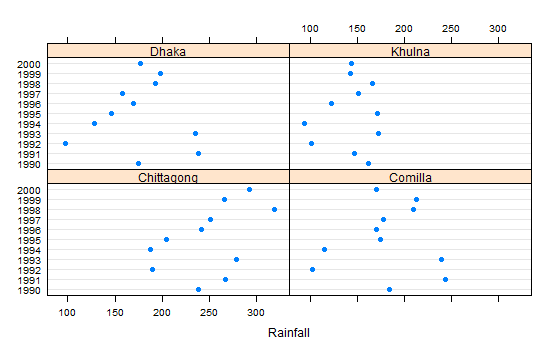
The graph shows the annual rainfall for the years grouped by the cities. This graph reveals the nice pattern of the distribution of annual rainfall over time. It helps the reader to compare four cities. Over time Dhaka and Chittagong experienced the increased annual rainfall. However, Khulna and Comilla had the almost same rainfall over time.
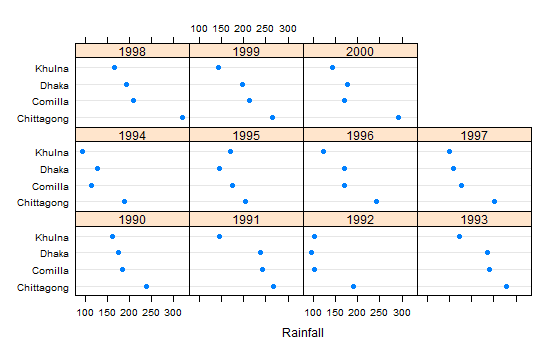
In the third graph I plotted annual rainfall for the cities grouped by the years. Though this graph shows the comparison s of four cities within each year, it is not easy to compare over time.
So I think the dotplot , drawn for rainfall data selected for some cities in Bangladesh, grouping by row (Cities) is good and nice rather than the dotplot, grouping by column (Years).
R code:
library(lattice)

d=read.table("Rain_data_BD.csv",header=TRUE,sep=",")

d$Year=factor(d$Year)
d.mean=sort(tapply(d$Rainfall,d$City, mean),decreasing=T)
dotplot(d.mean, main="Rainfall in Bangladesh Cities in 2005",
        xlab="Average Rainfall (mm) ",
       col=2, pch=19)


dotplot(Year~Rainfall|City, data=d )
windows()
dotplot(City~Rainfall|Year, data=d)