Logarithmic Scales (log base 2 and 10)
Posted by mislam on February 8, 2013
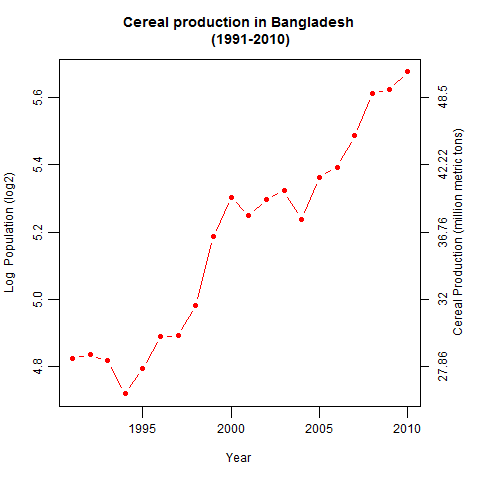
The graph shows the cereal production in Bangladesh during the time period 1991 2010. The log base 2 and the original productions are plotted in the graph. Over time the production increased very rapidly.
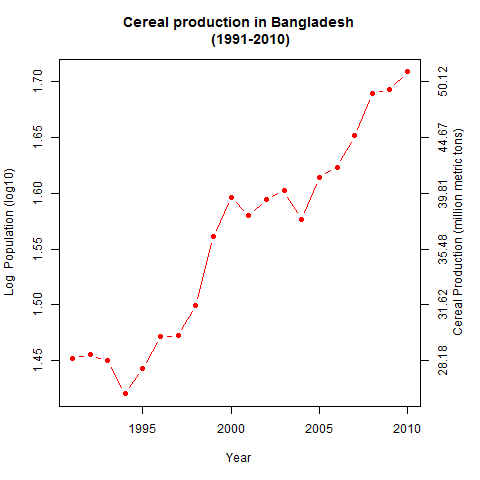
In the graph the log base 10 of cereal production is graphed against the time. This also shows the same pattern as in figure 1. The cereal production over the time had a upward tendency with some fluctuations.
In the both graph we plotted the original production in the right scale in order to understand the conversion from logarithmic scales to the original. Although both graph (log base 2 and 10) produces the same type graphs, log base 2 graph is more appropriate than log base 10 because log base 10 produces the fractional exponent of 10, which makes the conversion hard to understand.
That’s why I prefer the log base 2 graph to log base 10 graph for the cereal production data of Bangladesh.