Population Comparison of Bangladesh and Nepal 1971-1980
Posted by mislam on January 31, 2013
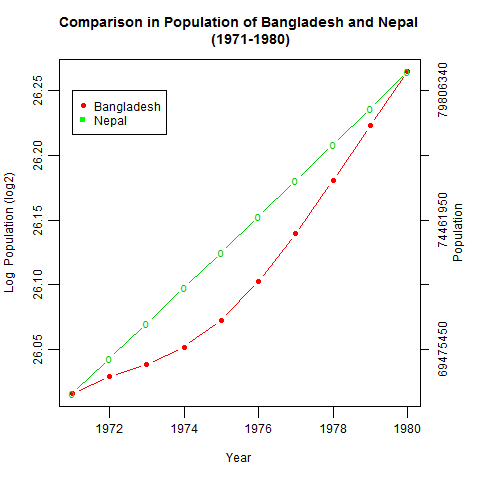
The graph shows a comparison of total population of Bangladesh and Nepal during 1971-1980. Over time the population of both countries increased rapidly.The total Population of Bangladesh grew exponentially over the decade. However, in Nepal it grew linearly over the same time period.
R code
rm(list=ls())
windows(height=10, width=10)
#png("BD_Nepal.png")
BD_Population<-read.table("BD_population.csv", sep=",", header=T)
Nepal.P<-read.table("Nepal_T_Population.csv",sep=",",header=T)


par(oma=c(0,0,0,2))
#par(mar=par()$mar+c(0,0,0,3))


within( BD_Population, plot(log2(Population)~Year,  ylab="Log  Population (log2)", axes=T,type="b",
                            tck=1,tcl=-.75,col="2", pch=19))
title("Comparison in Population of Bangladesh and Nepal\
      (1971-1980)")

tm = par("yaxp")

ticmarks = seq(tm[1], tm[2], length=tm[3]+1)
axis(4, at=ticmarks,labels=as.character( round(2^ticmarks,-1)))
mtext("Population", side=4, line=2)
legend(1971,26.25,c("Bangladesh","Nepal"),pch=c(19,15),col=c("red","green"))
par(new=T)
within (Nepal.P, plot(log2(Total.Population)~Year,type="b",xlab="", ylab="",axes=F,pch="o",col=3))


#dev.off()