For the first example, I chose a pie chart that showed daily phone activities for smartphone owners. The breakdown of the activities are provided below in Figure 1.
Figure 1. 
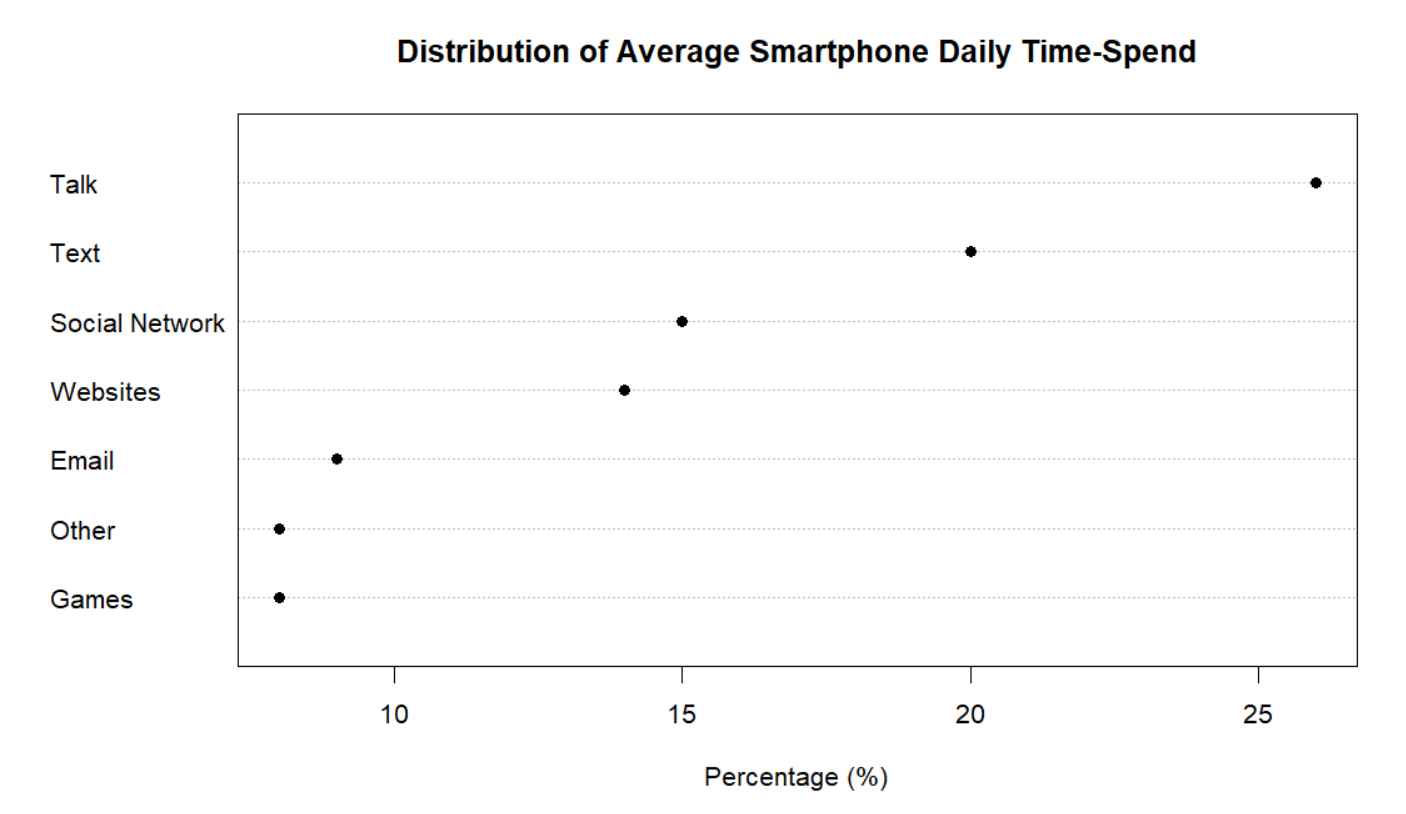
Although this pie chart is visually appealing and shows us the overall distribution of smartphone owners’ time usage, it’s hard to identify patterns quickly. In Figure 2. below, I constructed a dot plot where phone activities were plotted against percentage in an increasing order.
Figure 2.

I believe that the dot plot is an improvement to the pie chart. The dot plot allows us to decode the information above and see patterns that we wouldn’t before. We can easily identify each point and match it to its percentage and phone activity. For instance, we can quickly observe that Games and Other have the smallest percentage. Following the trend from left to right, we can say with confidence that Talk is the phone activity with the largest percentage. This method of table look-up is far more efficient that trying to mentally order the pie slices from lowest to highest percentage.
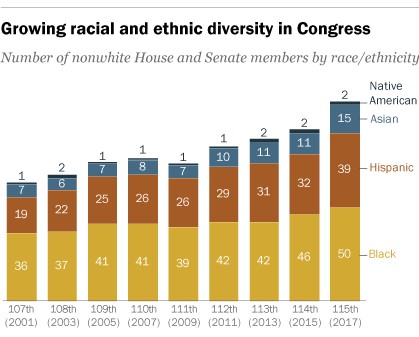
For the second example of this assignment, I chose a divided bar chart. The divided bar chart shows the number of people of color (POC) in Congress from 2001 to 2017 (9 Congress terms). The people of color are classified by race and ethnicity. They include black, Hispanic, Asian and Native Americans. The divided bar chart is shown below.
Figure 3.

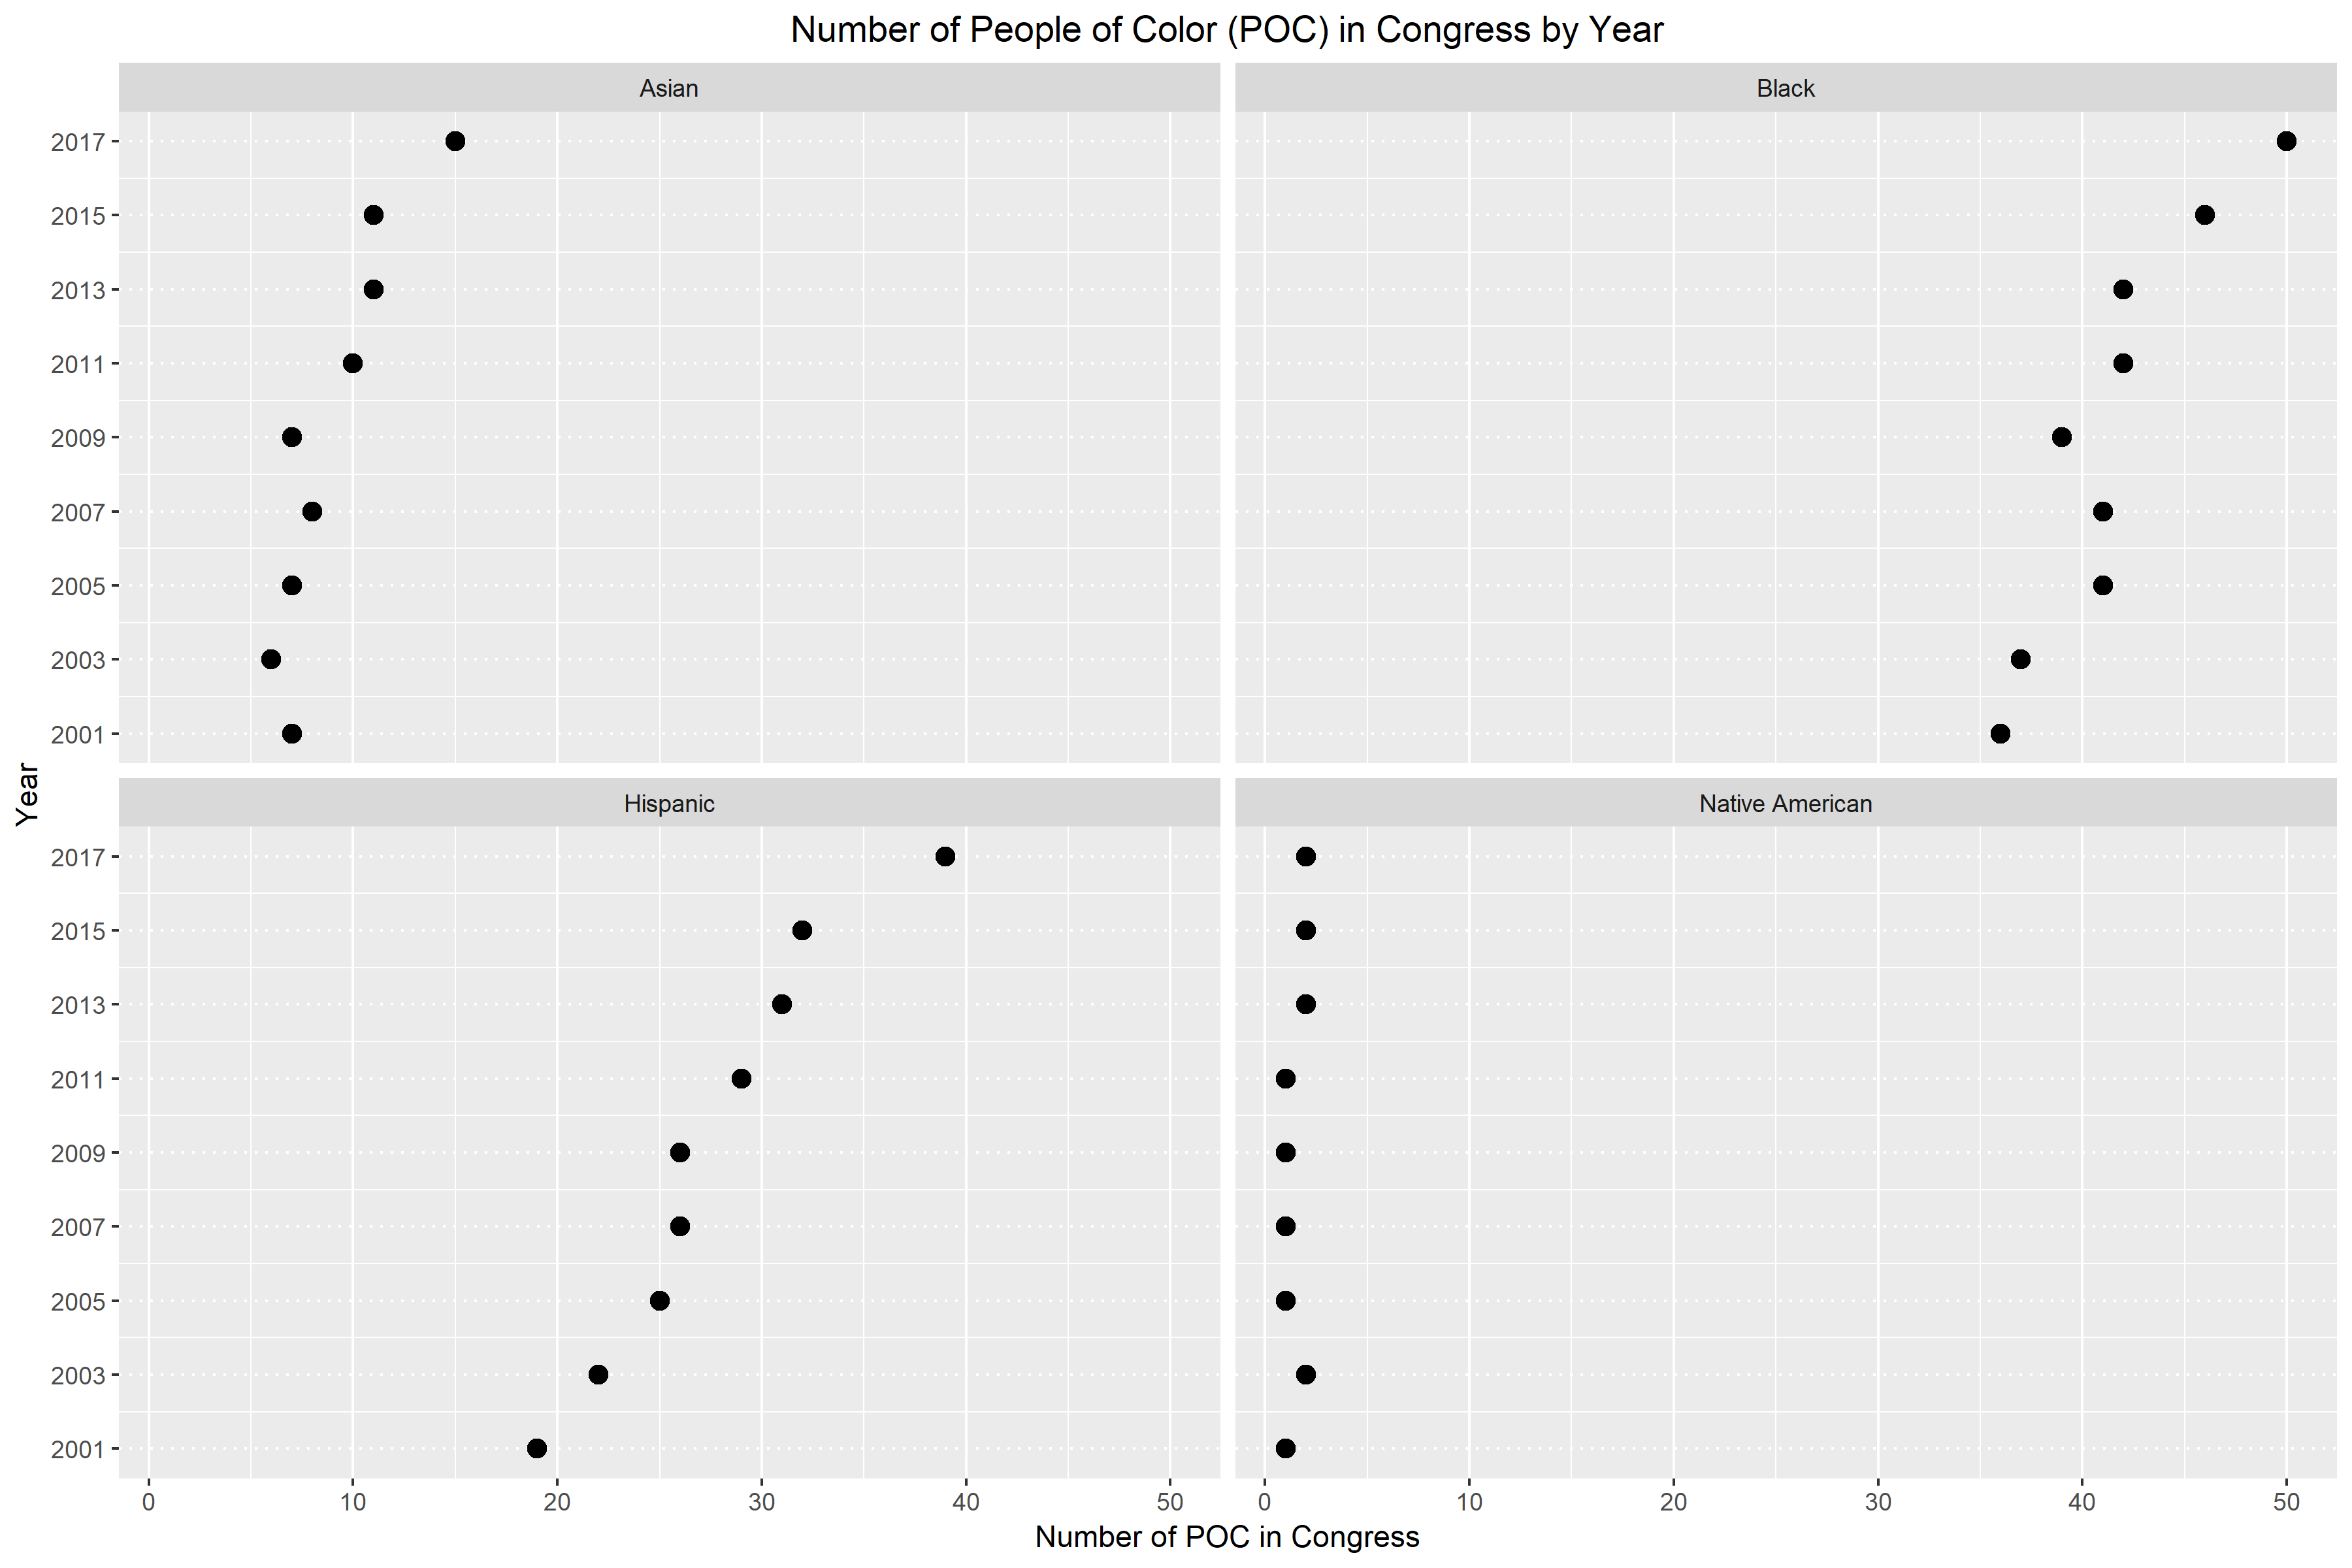
This graph is a good example of a divided bar chart but again, it’s hard to quickly note any patterns. In Figure 4., I constructed a multiway dot plot. The multiway dot plot was classified by race and ethnicity.

Again, I believe that the multiway dot plot is an improvement of the divided bar chart. In Figure 4., it becomes really obvious whether there is a pattern or not. For the most part, we can easily see that racial and ethnic diversity is growing in Congress. The only panel that doesn’t support this claim is the bottom right panel for Native Americans. For Native Americans, we see that they are still largely underrepresented in Congress. The number of Native Americans in Congress has been wavering between one and two for the last 17 years. Additionally, I believe that this multiway dot plot is an improvement because we can easily decode the information by table look-up. If the numbers were not on the divided bar chart, there would be no way of knowing how many people are represented by each chunk of color. However, the multiway dot plot allows us to navigate back and forth between the point and its corresponding year and number.