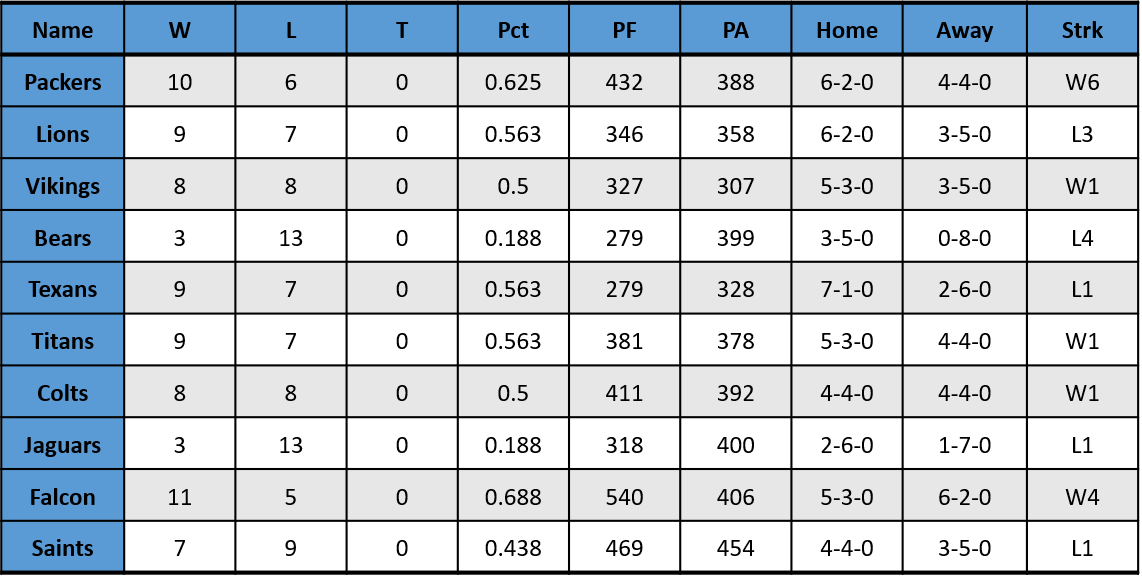
The data that I collected was based on the 2016 NFL Standings for 10 teams. The data is provided in the table below, where PF (instead of P) represent “points for” the team.
Table 1.
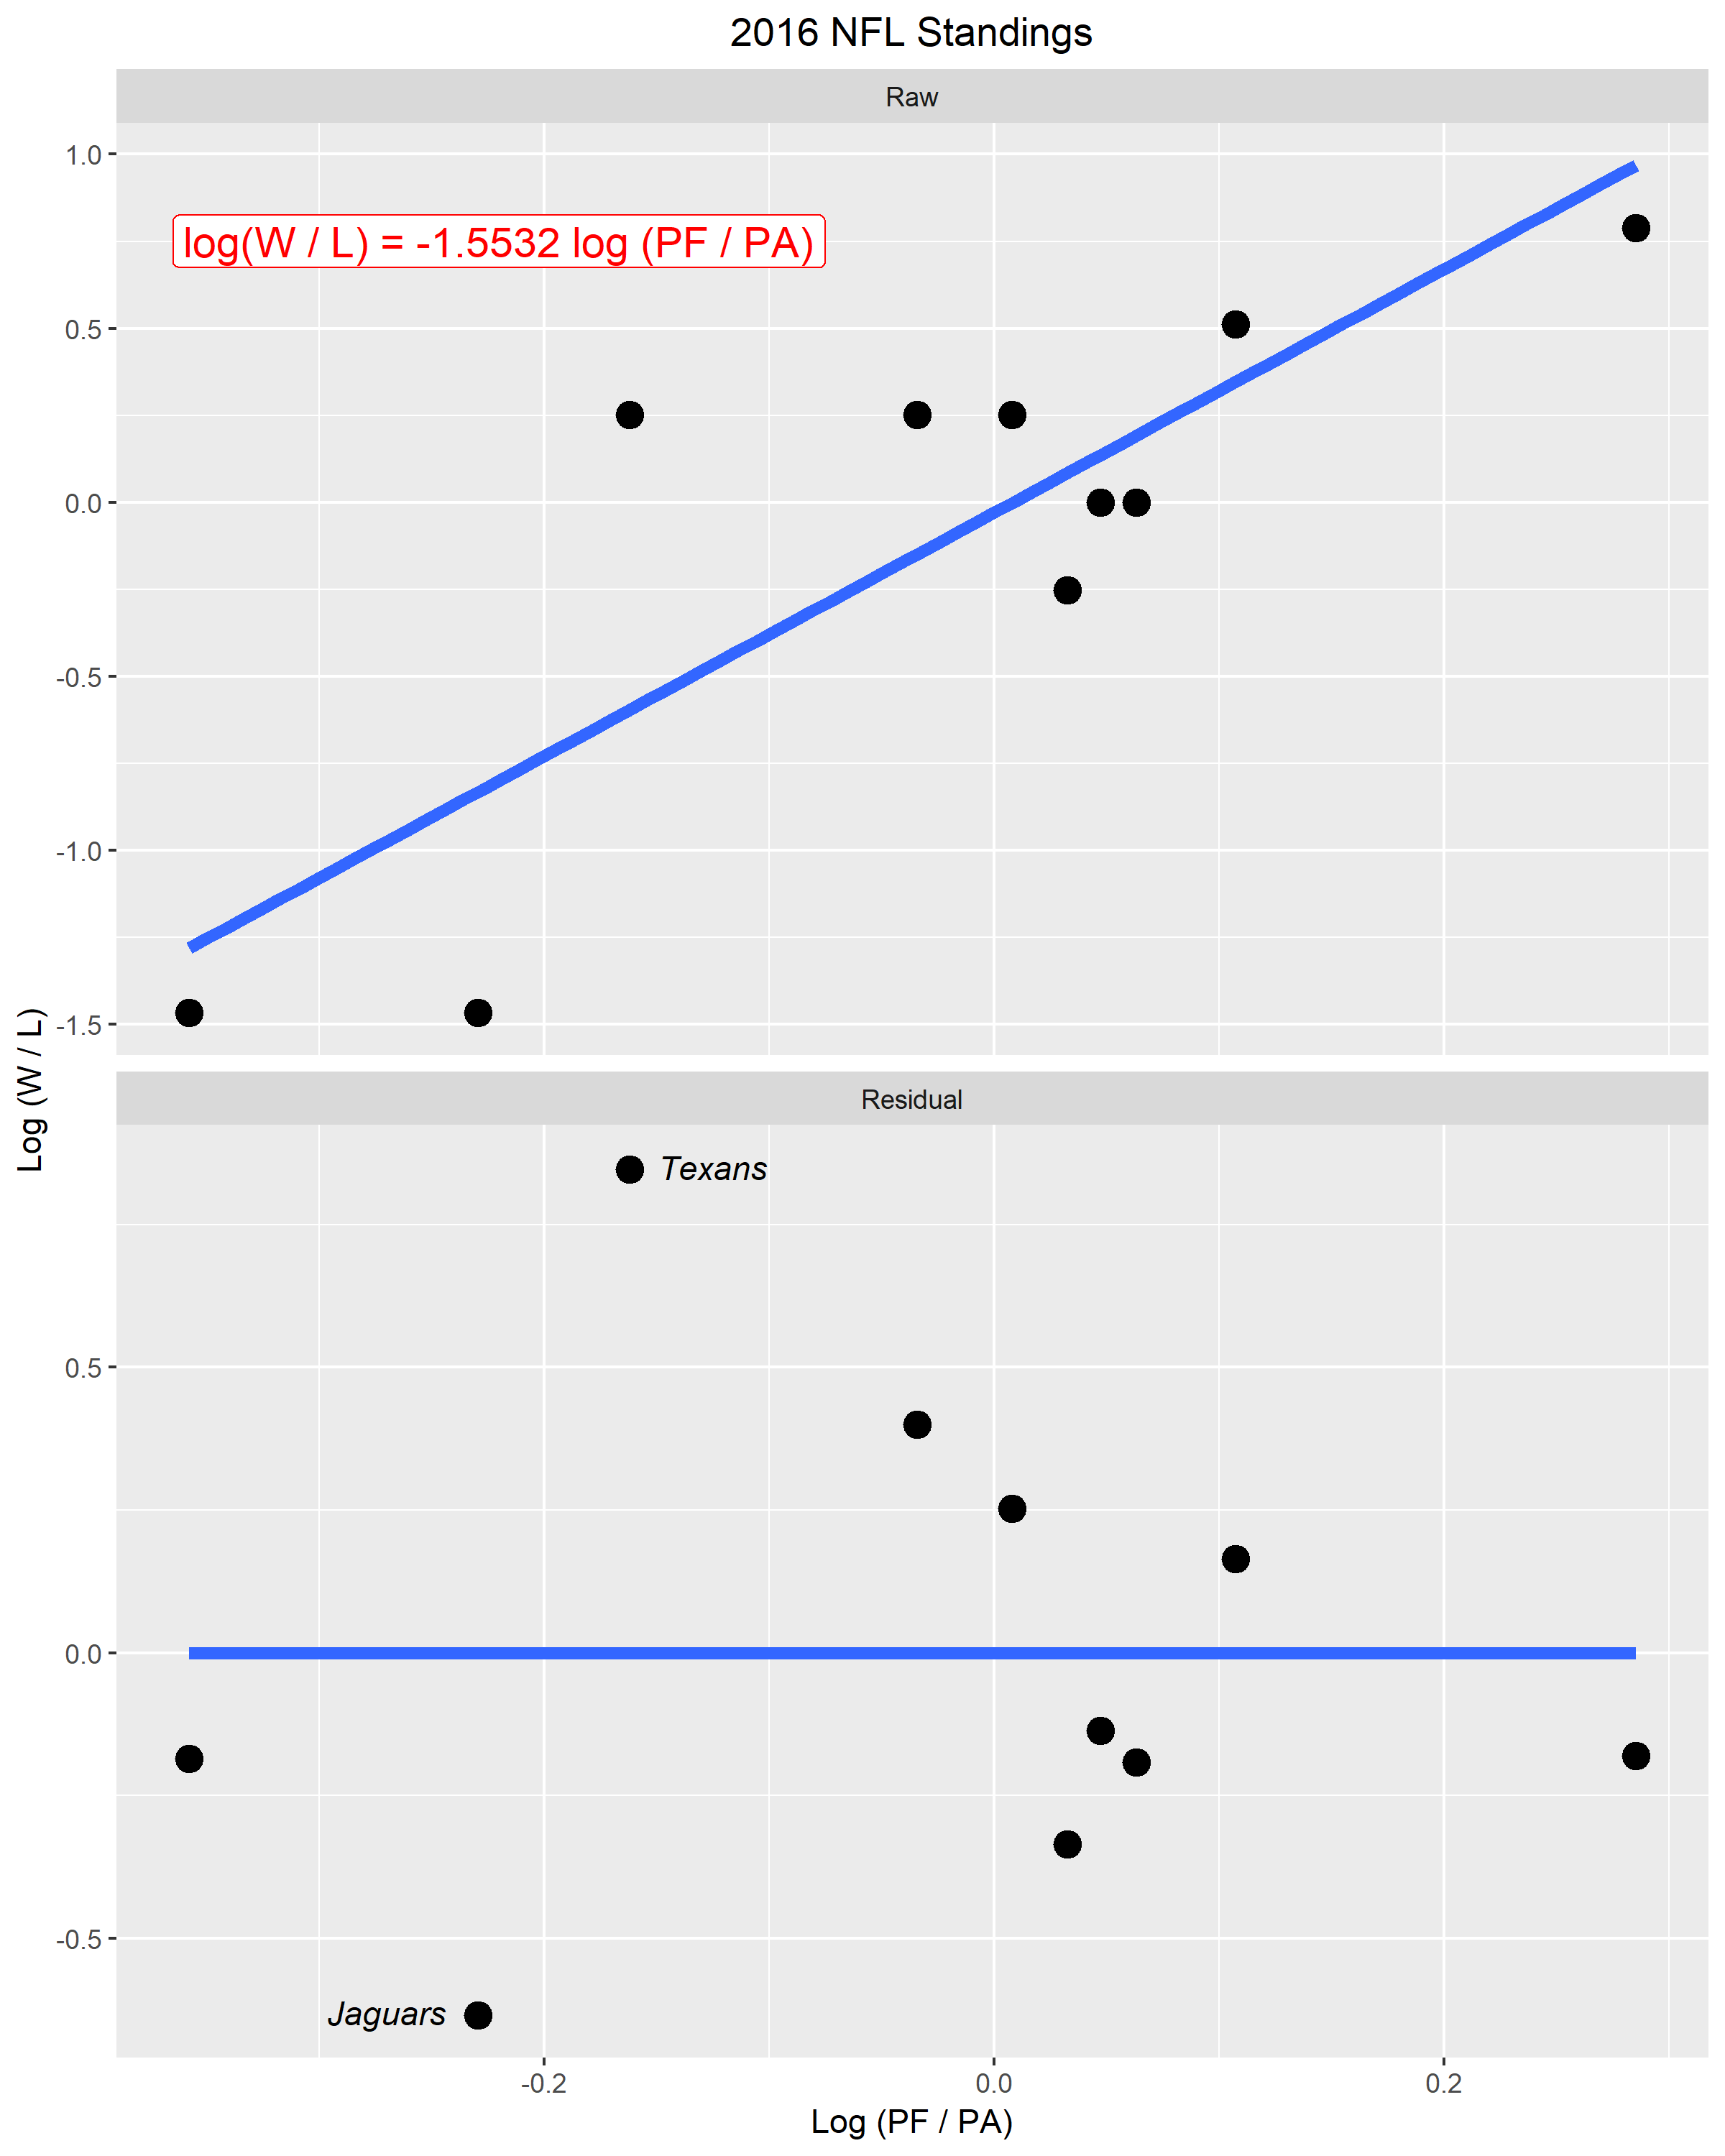
In the top panel of Figure 1., the horizontal scale measures the log ratio of total points scored for the team and total points scored against the team. The vertical scale graphs the log ratio of total wins and losses in the season. The best fitting line takes the form log (W / L) = k log (PF / PA), where k is taken to be -1.5532 in this particular data set. I chose -1.5532 to be the ideal exponent because when (PF / PA) is taken to the power of -1.5532, it returned the closest values for number of wins. Additionally, the k that I chose fit the data best.
The bottom panel of Figure 1. is a plot of residuals against log (PF / PA). In this figure, I labeled two points that seemed “unusual” compared to the rest of the data. I identified these two “unusual” points by labeling them with their respective team names, Texans and Jaguars. These two points seemed “unusual” because their residuals were much greater compared to the rest of the data points. Furthermore, due to these two data points, the residual was not evenly distributed vertically.
Figure 1.
