Figure 1.

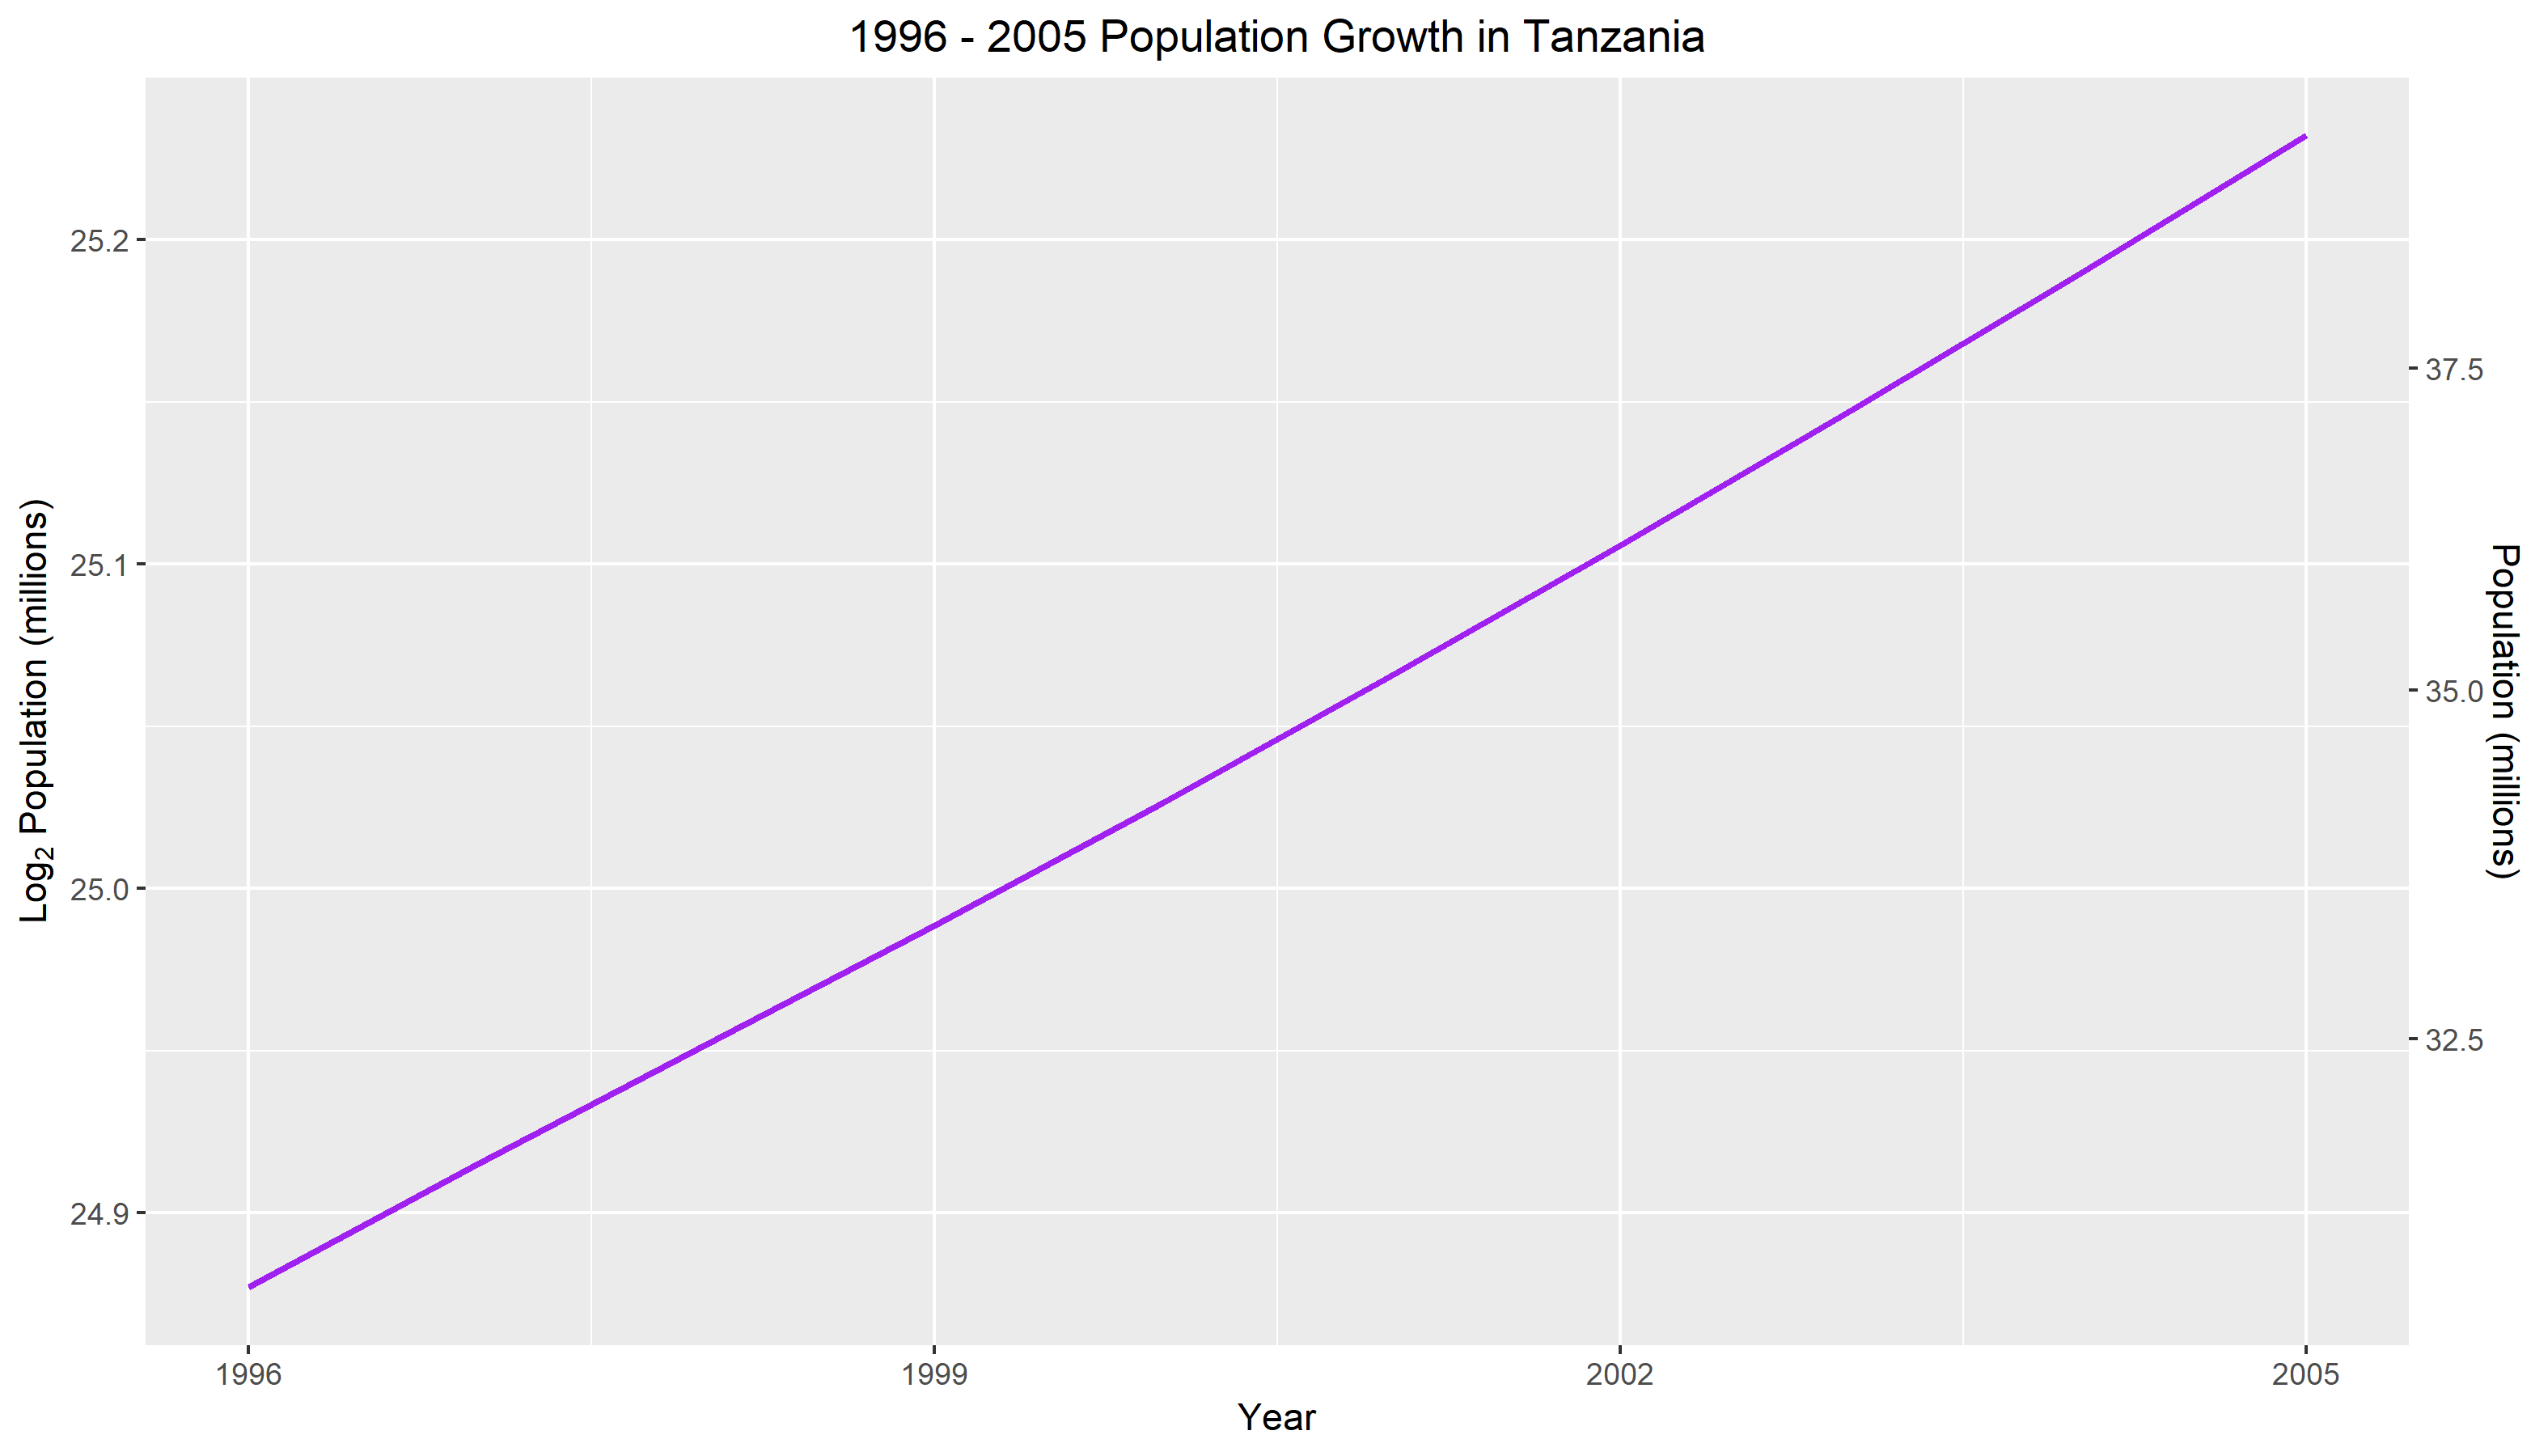
Figure 1. measures the population growth in Tanzania for a ten year frame. The horizontal scale is measured in years starting from 1996 to 2005. The left vertical axis uses a log base 2 scale and is measured in millions. The right vertical scale uses the original population units and is calculated in millions. From looking at the graph, we can see that there is an exponential relationship for population growth in Tanzania. That is, with each passing year, the population tends to increase. Comparing the year 1996 to 2005, we can see that the population has increased from less than 32.5 million to more than 37.5 million. Although the rate of change is minuscule, we can see that the slope is slowly getting steeper with each year.
Figure 2.

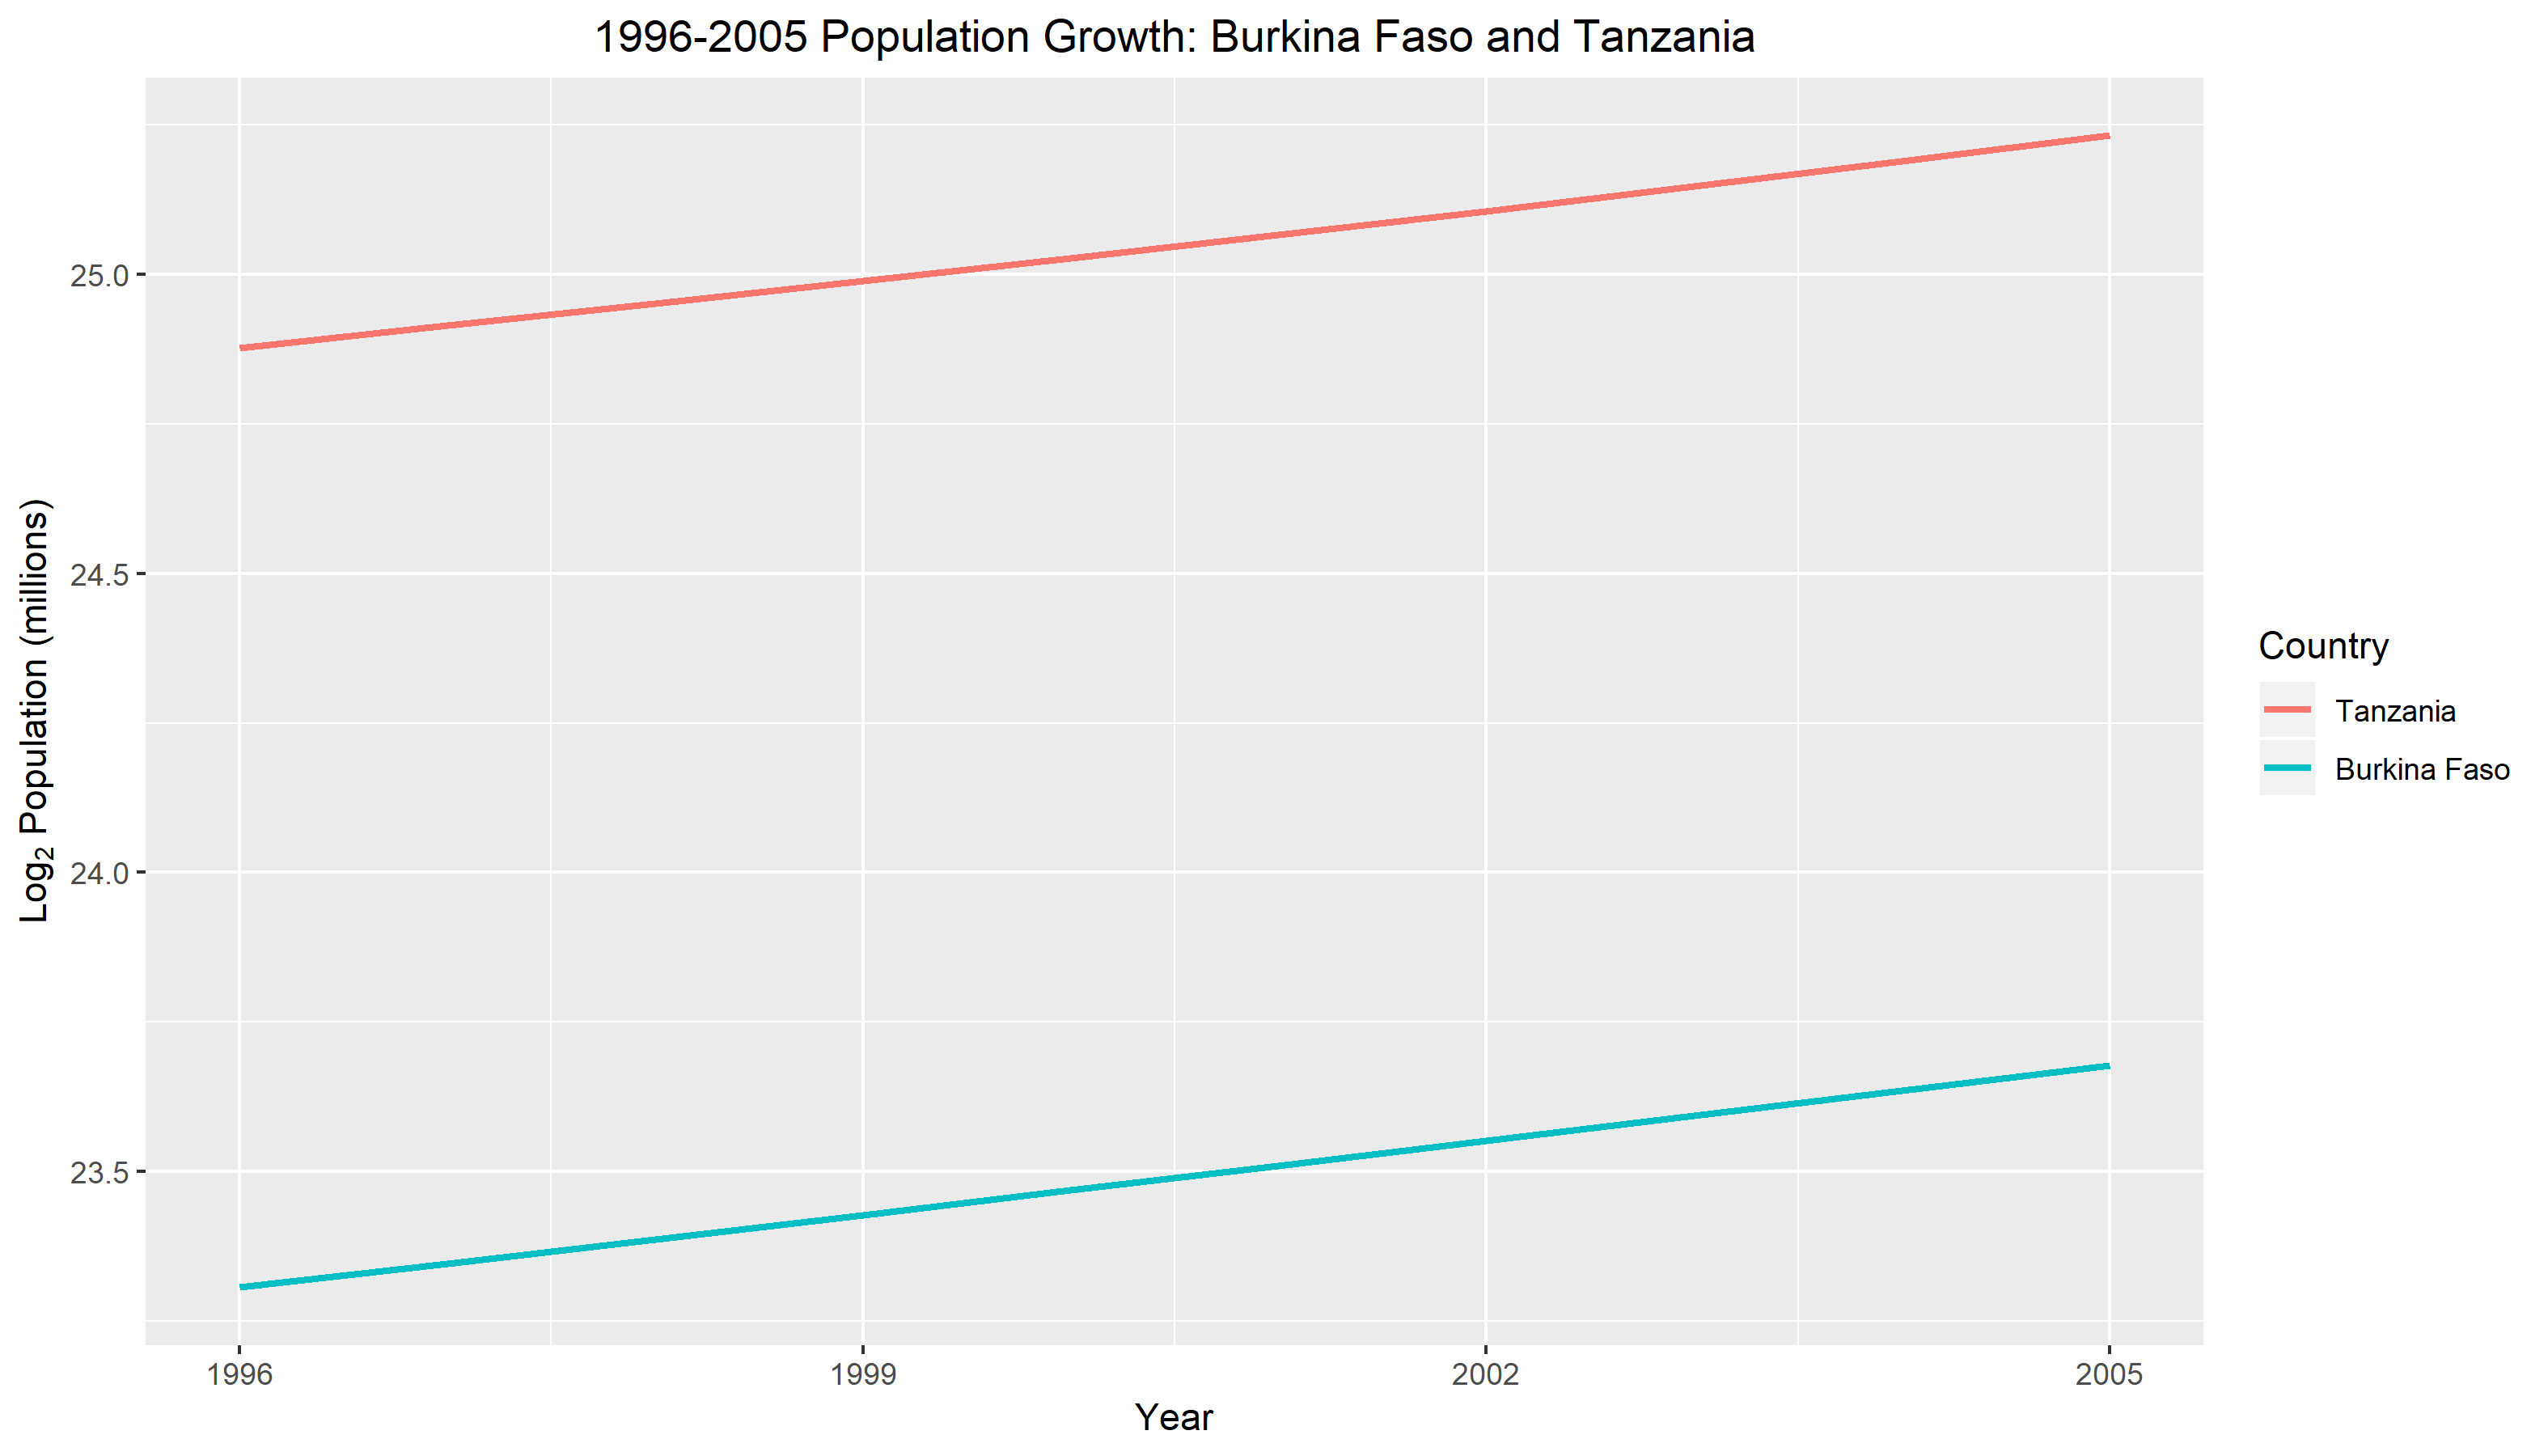
In Figure 2. we compare the log base 2 population growth against year for two countries. The two countries in this study are Burkina Faso and Tanzania. The horizontal scale is measured in years from 1996 to 2005. The vertical scale uses a log base 2 transformation and is given in millions. The graph reveals to us right away that Burkina Faso has a much smaller population size compared to Tanzania. This can be seen from the distance between the two connecting lines. Although their population sizes are different, both countries displays an exponential relationship between population and year. We can see from the graph that with each year that goes by, the population is increasing at a steady rate.