For this blog, I have picked two pop charts from the media; a pie chart and a divided bar chart as shown below;
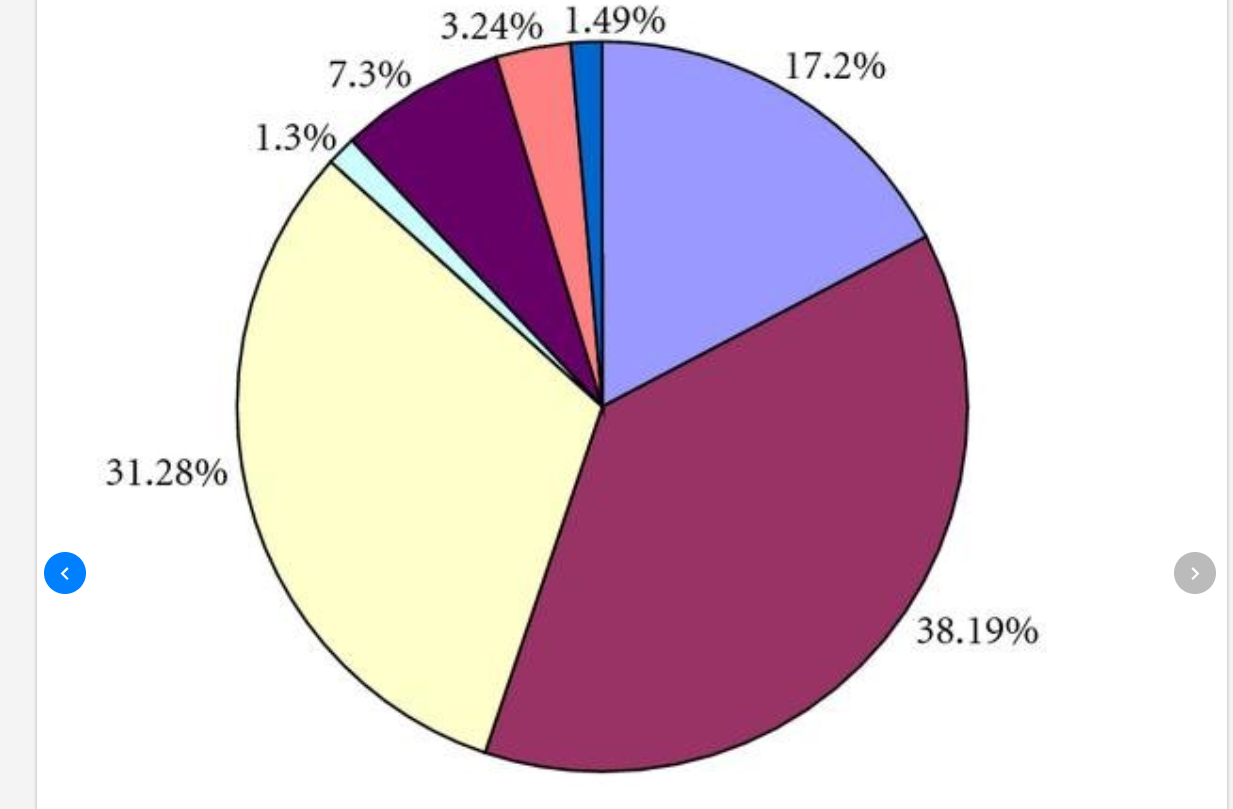
The first pop-chart that I found in media is the pie-chart of Honey composition indicating the percentage share of various sugars, waters and other minor constituents which was published in Journal of Bio-medicine and Biotechnology, February 2009.
For this pie chart, I have redrawn a dot plot which is shown below. It is clear that dot plot is more effective than the pie chart as it improves the pattern perception. Even though, the pie chart uses different color to indicate different components, the dot-plot makes the table look-up easier for readers to detect, assemble and estimate the output.

The second pop chart, I found is divided bar chart having three variables; production in kg, Years, and Types of Cereal. It shows the quantity in hundred kgs of wheat, barley, and oats produced in certain form during the years 1991 to 1994.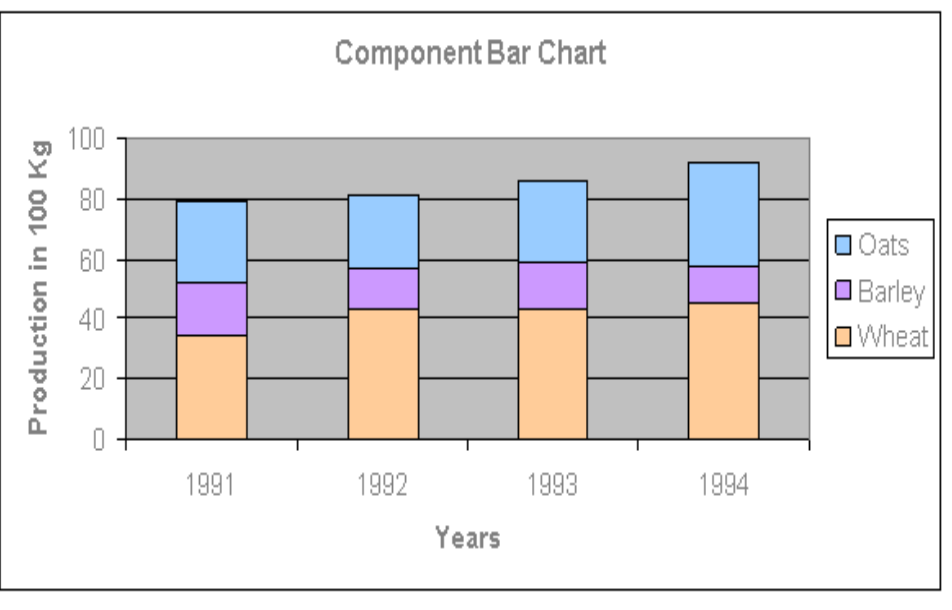
I redrew a multi-way dot plot grouped by Years for the above bar chart which is shown in the graph below. The new plot provides far more pattern perception and table look-up than the original divided bar chart. Also, It is much easier to view a distribution of the values in dot-plot and multi-way plot than those pop charts ( pie chart, bar chart).

Hence, overall we can say that these dot plot and multi-way plot improve the pattern perception and table look up for decoding visual information OR They increase the Table look up efficiently and have good pattern perception than those pop charts (pie charts and bar charts) found in the media.