Here, I have used three variables; calories, protein and fat from the dataset UScereal which we is stored in the MASS package of R programming. And, to see the relationship between these three variables, we can use different types of visualization methods as scatter plot matrix, coplot and spinning three dimensional scatter plot as given below.
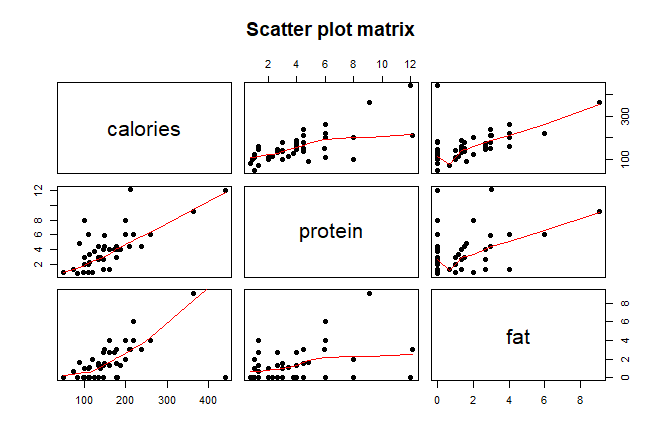
From the above scatter plot matrix, we can see that there is fairly strong positive association between variables calories and fat, calories and protein but weaker positive relation between protein and fat. That means, calories increase with the increase of level of fat as well as protein and vice versa. Also, even there is weaker positive association between fat and protein, we can say that the level of fat tends to increase with the increase in protein and vice versa.
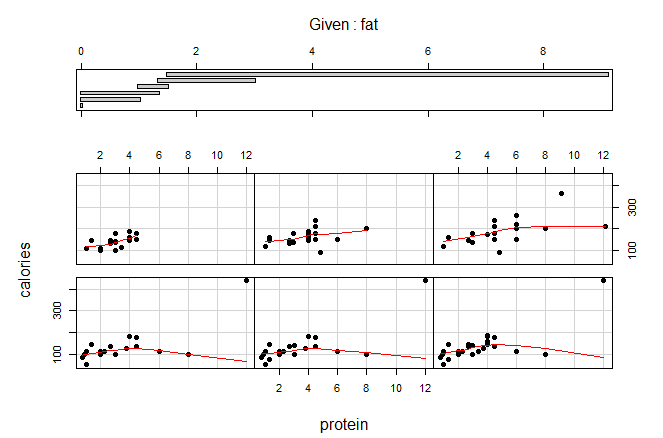


Above three plots are called coplot which gives more accurate result in than scatter plot matrix. In this plot, one variable is given and we find the relationship between other two variables.
In the first coplot, we can see the weaker positive association between calories and protein at the top panels and almost no association at the bottom panels when fat variable is given or controlled.
In second coplot, variable calories is given/controlled and we can see there is no association between fat and protein.
And in third graph, if we control variable protein, there will be strongly positive association between calories and fat as in the scatter plot matrix.

Finally from the above spinning 3D scatter plot matrix as well, we can see that is strongly positive association between calories and fat, weaker positive relationship between protein and calories and no association between protein and fat.
Two special cereals that seem to deviate from the general relationship patterns are; 1) Grape-Nuts which has the highest calories but lowest level of fat . 2) Great Grains Pecan.