In this blog post I will use scatter plot matrices, coplots and 3 dimensional scatter plot to explore the relationships between variables of a multivariate data set. The data set ‘UScereal‘ in the MASS package gives eleven variables for a group of 65 breakfast cereals. I will focus on these three variables– calories, sugars and protein.
Scatterplot matrices comes in handy when we wish explore the relationship between two numerical variable but the data set is multidimensional. In a scatterplot matrix, all pairwise scatterplots are arranged in a matrix with shared scales. This makes it easy to look at the rows or columns and see how one variable relates to others.
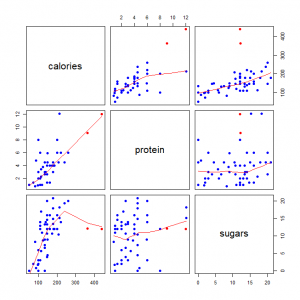
The graph below is a scatterplot matrix of the protein, calories and sugar content of 65 US breakfast cereals. From the plot we see that cereals with high sugars tends to have high calories. However, Great Grains Pecan and Grape-Nuts seems to deviate from this general from this general pattern. Also, cereals with high protein appears to have high calories. Thus, both protein and sugars have a positive linear linear relationship with calories. But protein seems to have a stronger relationship with calories. From the scatterplot, there seems to be very weak or no linear relationship between protein and sugars.
Coplot enables us to see how a response variable depends on two or more factors. The coplot below shows how protein depends on calories given the sugar content of the cereals. The top panel is the given panel, and the bottom is the dependence panels. each scatterplot corresponds to an interval of amount of sugar.
From the plot there seems to be a positive trend for all scatterplots. Thus, as the amount of sugar and calories increases, protein also increases. The relationship between calories and protein is nonlinear except for cereals with sugars between 6 – 12 and 11 – 13. 
One can visualize multivariate data by using a 3D plot . Below are three different views of a 3D plot of the variables. We see that calories have a positive linear relationship with sugars. Two points, which corresponds to Great Grains Pecan and Grape-Nuts , tends to deviate from the general trend.


