I long wondered when my days of dancing and singing in the high school musical would come into handy. Luckily, this week’s assignment examines the data for Broadway musicals. While my old dance shoes won’t come in handy here, my prior statistical skills and thirst for improved theatre knowledge should play as a featured role.
I downloaded the CSV file from the given link and began to analyze the data, particularly from both periods of 2000 to 2008, and 2009 to 2016. In this study, we are asked “what makes a Broadway show the best?” While it is almost impossible to qualify a work of art as “best” (that’s an argument for another class), we can use some parameters that would give us a glimpse into their popularity and feature in the zeitgeist.
I had considered attendance, number of weeks performing, size of the theatre, and several other factors for the “best” descriptor. However, I decided that “gross income” for the show would be an excellent indicator. Current blockbusters like Hamilton and The Book of Mormon not only have high attendance numbers, but they also require the theatregoer to dole out large amounts of money per ticket, due to high demand. Gross is positively correlated to attendance, as one might imagine, but I would also wager that gross and ticket price (and tangentially, demand) share some positive correlation.
To compare every single Broadway show by gross income would indeed be a gargantuan task; as a result, I am only comparing highly grossing shows. In my study, the shows displayed in the figures have cumulatively made over 200,000,000 dollars. This reduces the number of shows, which makes it easier to analyze.
I used RStudio to make my graphs. First, I have a set of grouped bar graphs included below. The first graph is a bad one. Let’s take a look at it:

Do not adjust your computer screen; I am well aware that there are some issues with the graph. First, the labels are all clustered together on the x-axis. It is impossible to read which shows are being presented. This can be fixed by changing the location of the x and y-axes. Second, the x and y labels need to be interchanged. Third, the title is acceptable, but it might be useful to declare that this is a grouped bar chart. Upon looking at these mistakes, I made some edits and the new final product is seen below:

This graph is much improved compared to the first one presented. First, the x and y-axes have been switched, allowing us to read the bar labels without any obstruction. Second, the axis labels are in the correct location. Upon looking at this graph, The Lion King is the highest grossing Broadway show in both the 2000-2008 and 2009-2016 periods. The show Wicked comes second in total gross among the periods, with The Book of Mormon rounding out as the third highest grossing show. To a Broadway fan like myself, this makes sense: The Lion King and Wicked are often considered in the theatre wing to be the most popular shows of the past two decades, and these Tony-Award winning shows are highly acclaimed by audiences and critics.
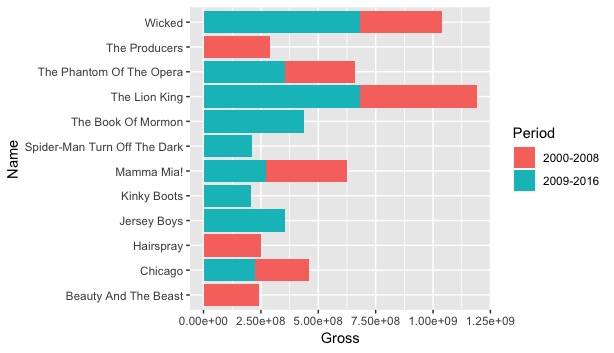
I was curious to see the stacked bar charts for this data, since several of these shows have runs spanning throughout both periods. As a result, I created two versions of this specific type of chart: a “bad” version and a “good” version. The bad version is displayed below:

You can deduce why this would be considered the “bad” version of the graph. First, the graph does not have a title. To the common viewer, one might not know what the graph is display, aside from gross. The y-axis label “Name” also does not provide enough context to the average viewer. Second, the stacked bars are not arranged in size order, which makes it a little more difficult (while not impossible) to analyze. A positive of the graph? A legend is provided outside the data rectangle, and the axes are correctly labeled. The second graph, seen below, improves on those identified mistakes:

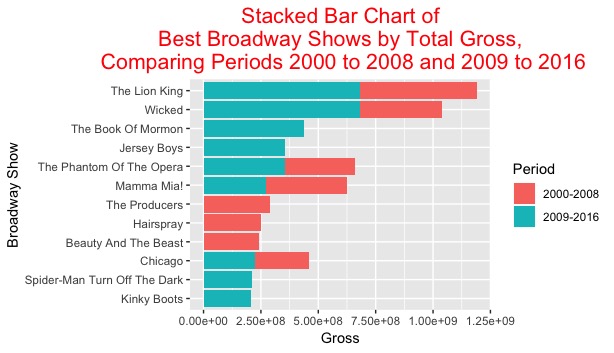
As one can see, the title of the graph provides context of 1. the type of graph, and 2. the exact data being studied without any confusion. The data has been arranged in decreasing order, with the largest total gross on the top of the graph and the smallest total gross income on the bottom. The graph arranges the data according to largest total gross per period as well. This characteristic can be seen when comparing The Book of Mormon and The Phantom of the Opera. The Book of Mormon is placed higher on the graph due to the fact that it had a higher gross within a single period; that being said, The Phantom of the Opera had a higher overall gross throughout its entire run.
As stated with the grouped bar charts, The Lion King has the record for largest overall gross within the two periods. By my own criteria, The Lion King would be considered the best Broadway show from 2000-2008 and 2009-2016. The show has amassed almost 1.25 billion dollars in ticket sales during its run. There are some other shows with high gross incomes that could claim the title as “best.” Wicked, like the Lion King, has grossed over 1 billion dollars and has immense global popularity. The Book of Mormon, while only active in the 2009-2016 period, has grossed just under 500 million dollars, which is one of the largest values for a single period. Based on my own parameters, the “best” shows in these periods would be The Lion King, Wicked, and The Book of Mormon.