The dataset UScereal in the MASS package gives eleven variables for a group of 65 breakfast cereals. I choose the variable calories, sodium and potassium to explore their general relationships using the scatterplot matrix, the coplot, and the spinning 3-dimensional scatterplot below.
Scatterplot matrix:
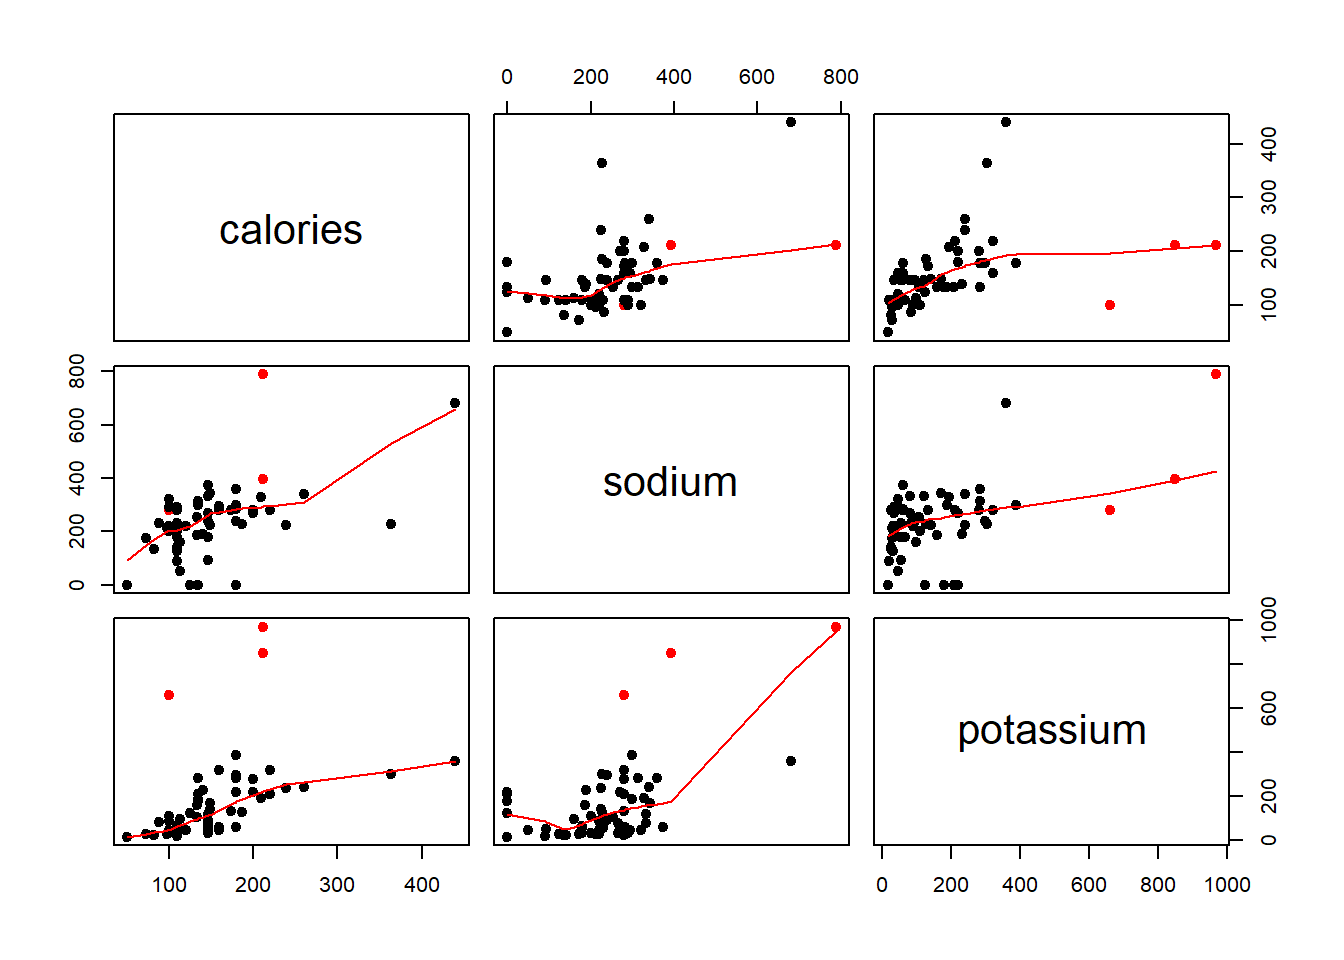
There is a general positive trend between calories and sodium, cereals with higher calories tend to contain more sodium as well. And this positive correlation is even more solid with calories and potassium as dots stay closer to the smoothing despite the fact that there are three “special” types of cereals which are the “100% Bran”, “All-Bran with Extra Fiber”, and “All-Bran”(red dots) whose potassium is abnormally high at a relatively small calorie value . Also, cereals with higher sodium tend to contain more potassium.
Coplot:
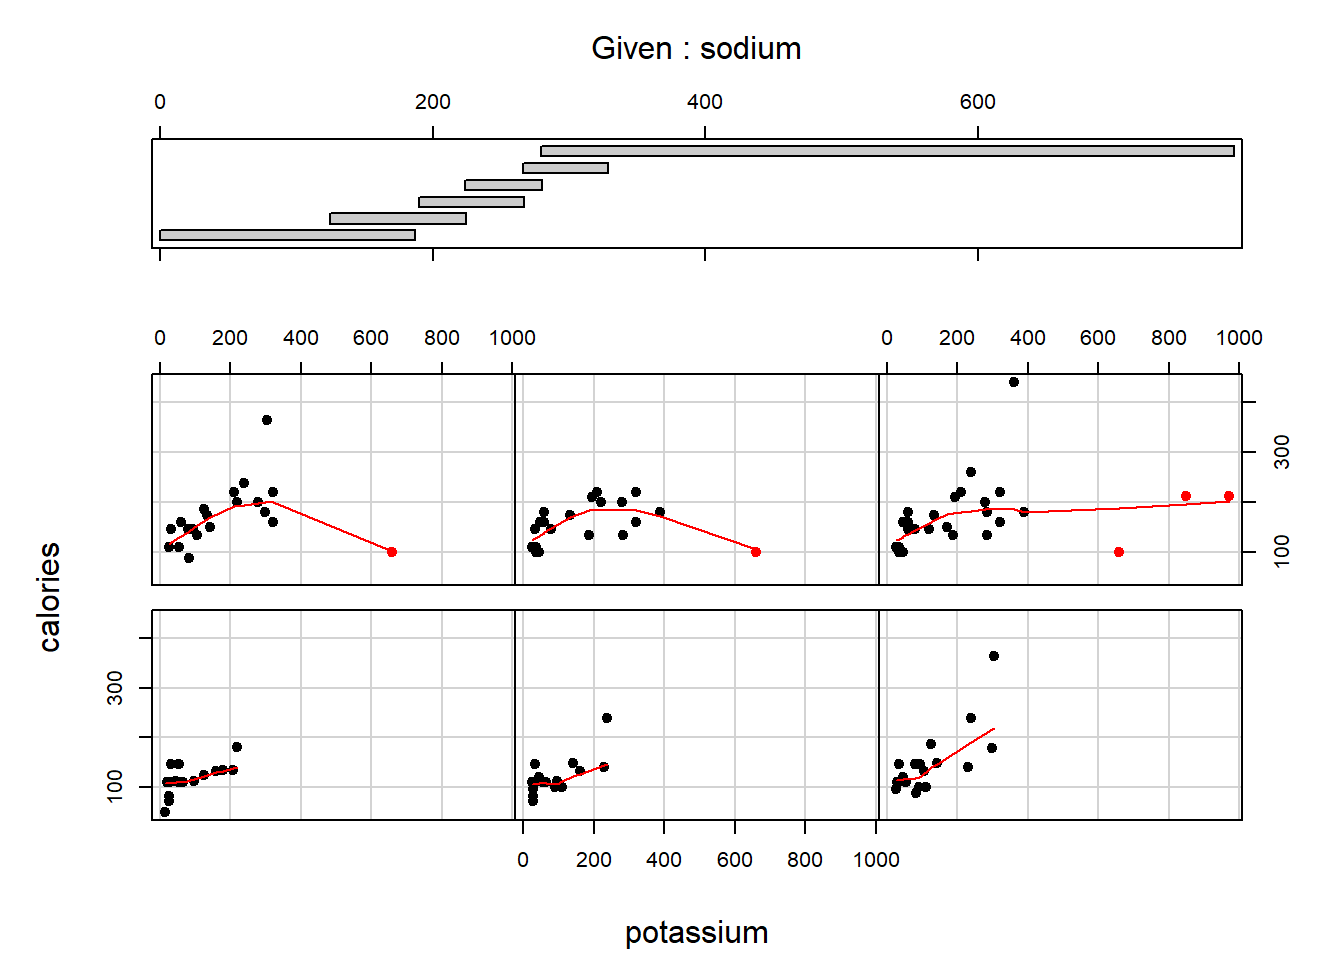
As seem from the scatterplot matrix above, the values of sodium are quite constant and we seem to be more interested in the stronger correlation between calories and potassium so I construct this coplot of calories as a function of potassium given sodium. We’re supposed to observe a solid positive slope which is not always the case shown in this coplot since these three “special” cereals are quite off the trend.
Spinning 3-dimensional scatterplot:
The spinning feature helps us observe the 3-d structure of theses three variables. What we can see from this plot is that most observations do not stray far from the “diagonal” of the cube where all these three variables change in the same direction which verifies the fact that there are general positive trends between the calories, sodium and potassium.