Baseball standings dataset:
the data represents MLB standings foe 2018: there are 12 teams with variables explained below:
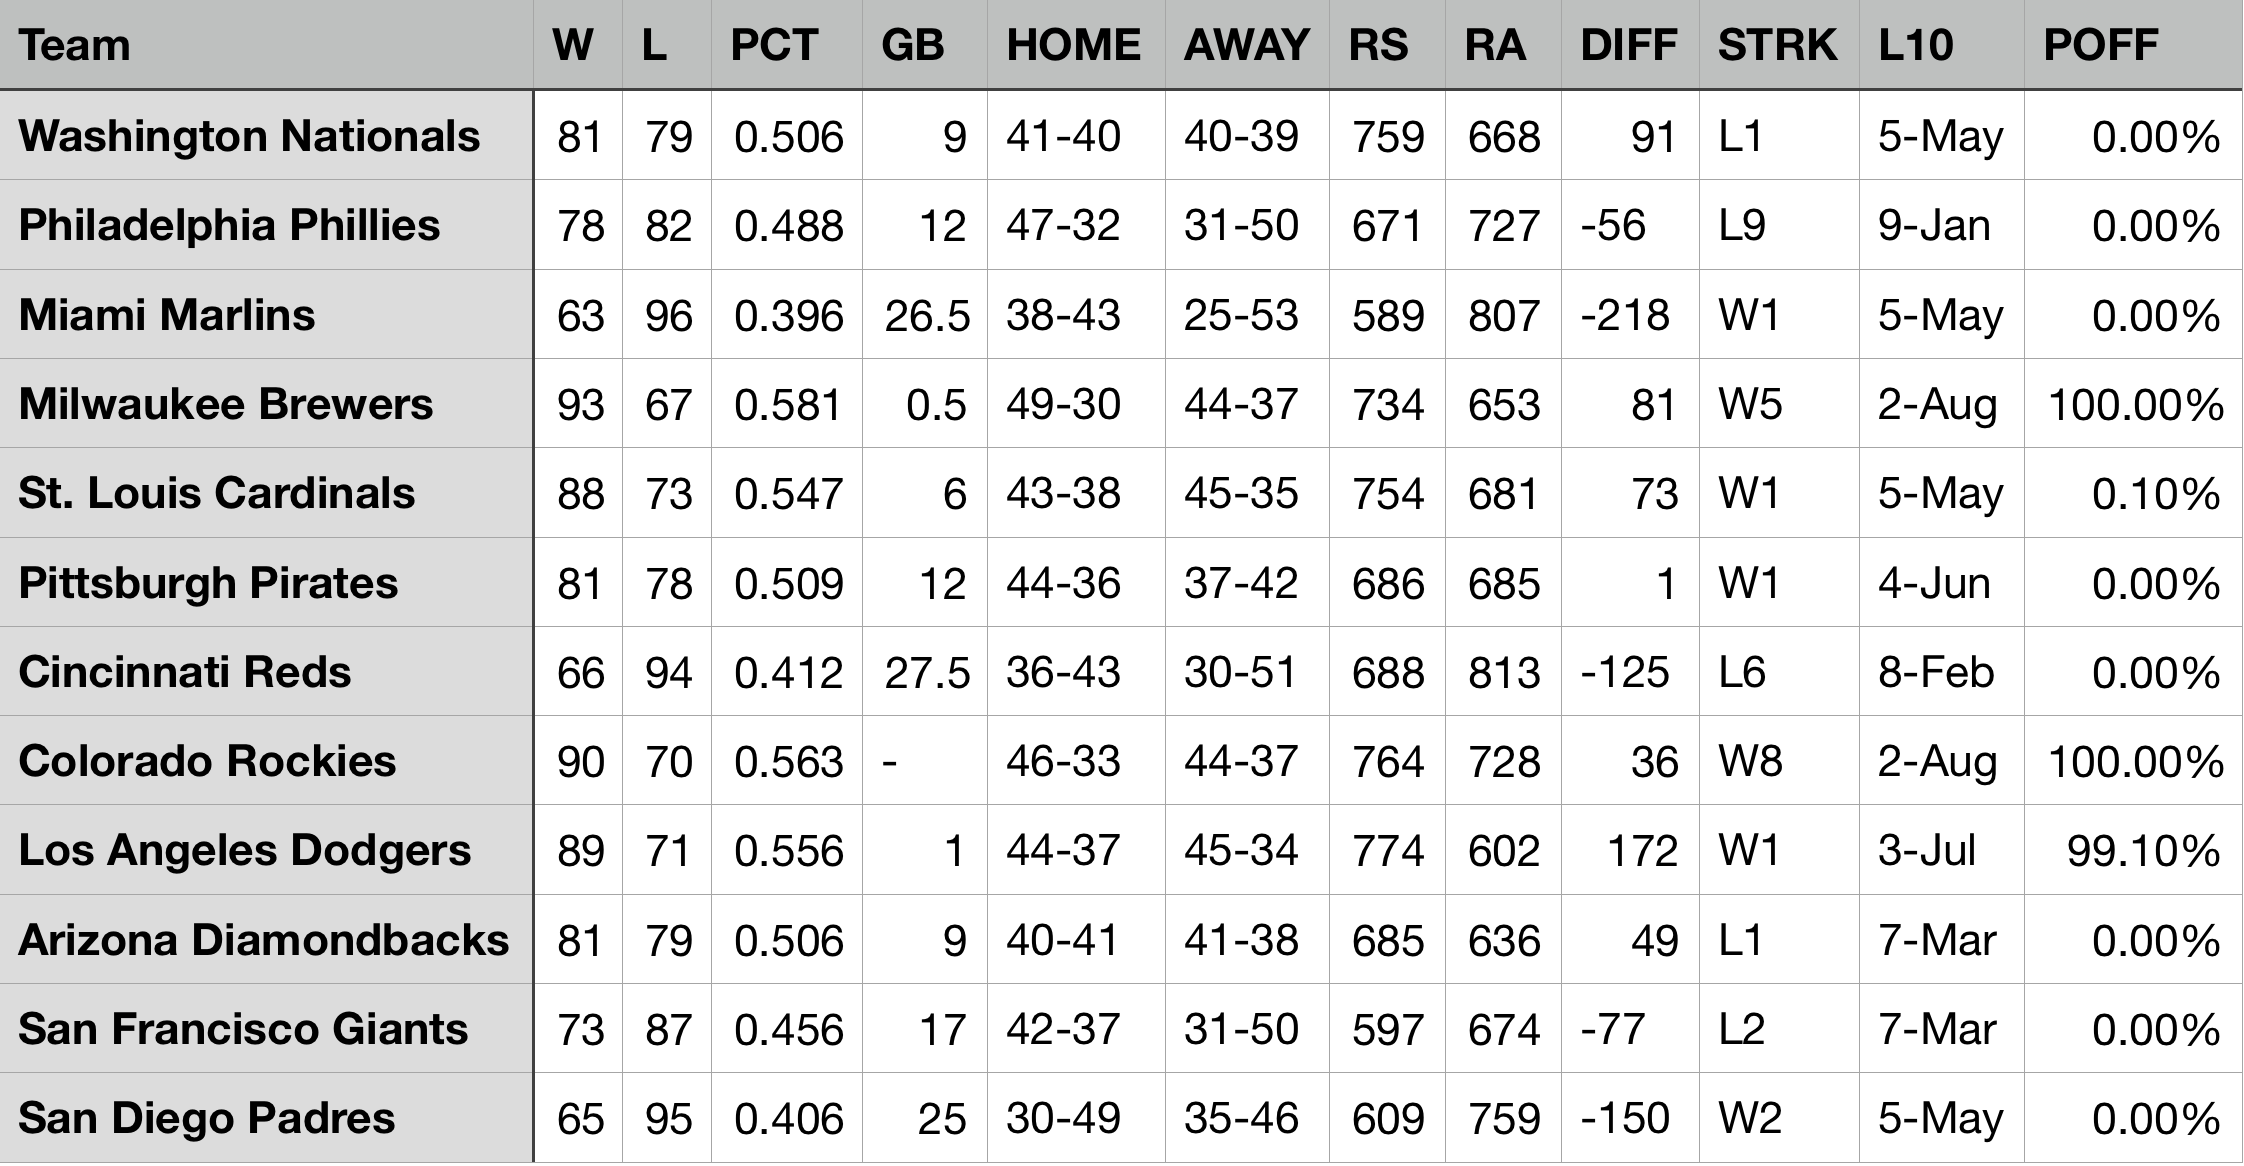
GLOSSARY of the data:
- W:Wins
- L:Losses
- PCT:Winning Percentage
- GB:Games Back
- HOME:Home Record
- AWAY:Away Record
- RS:Runs scored
- RA:Runs allowed
- DIFF:Run Differential
- STRK:Current Streak
- L10:Record last 10 games
- POFF:% chance of making the playoffs
- * –:Clinched Best League Record
- Y –:Clinched Wild Card
- X –:Clinched Division
Pythagorean Formula and residual plot:
The first graph below is the scatter plot of log (W/L) against log (RS/RA) which demonstrate the Pythagorean Formula
, and the second plot is the residuals against log (RS/RA).

It seems to have a linear relationship between log (W/L) and log (RS/RA). fitting a linear model log (W/L) ~ log (RS/RA) will yield to: slope =1.4 and intercept almost equals to 0.
With R square is around 82% and pretty small p-value= 5.359e-05, we concede that the model fitted the data pretty well so the best k value is the slope 1.4.
The Colorado Rockies and Milwaukee teams considered lucky teams because they have the highest residual values so their wins/losses is higher then predicted value.
The Washington Nationals considered unlucky team because it has the least residual values so its wins/losses is lower then predicted value.