Here is NBA 2017-18 season standing. I used these data complete this blog assignment.
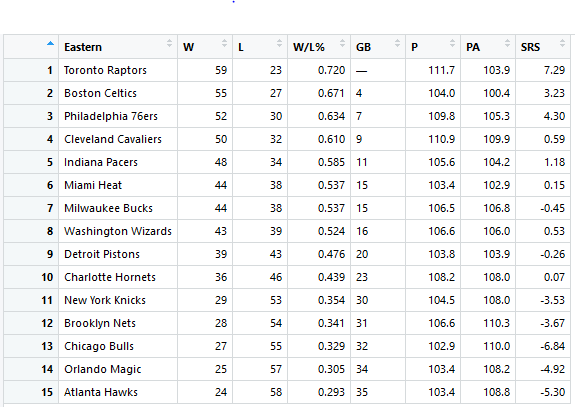
This data set contain seven variables and variable W, L, P and PA are numerical variables. The data is the season summary for 15 teams of the Eastern Conference of the NBA. I used the following variables to graph the above plot.
W – the number of games won
L – the number of games lost
P – Points per game
PA – Opponent points per game
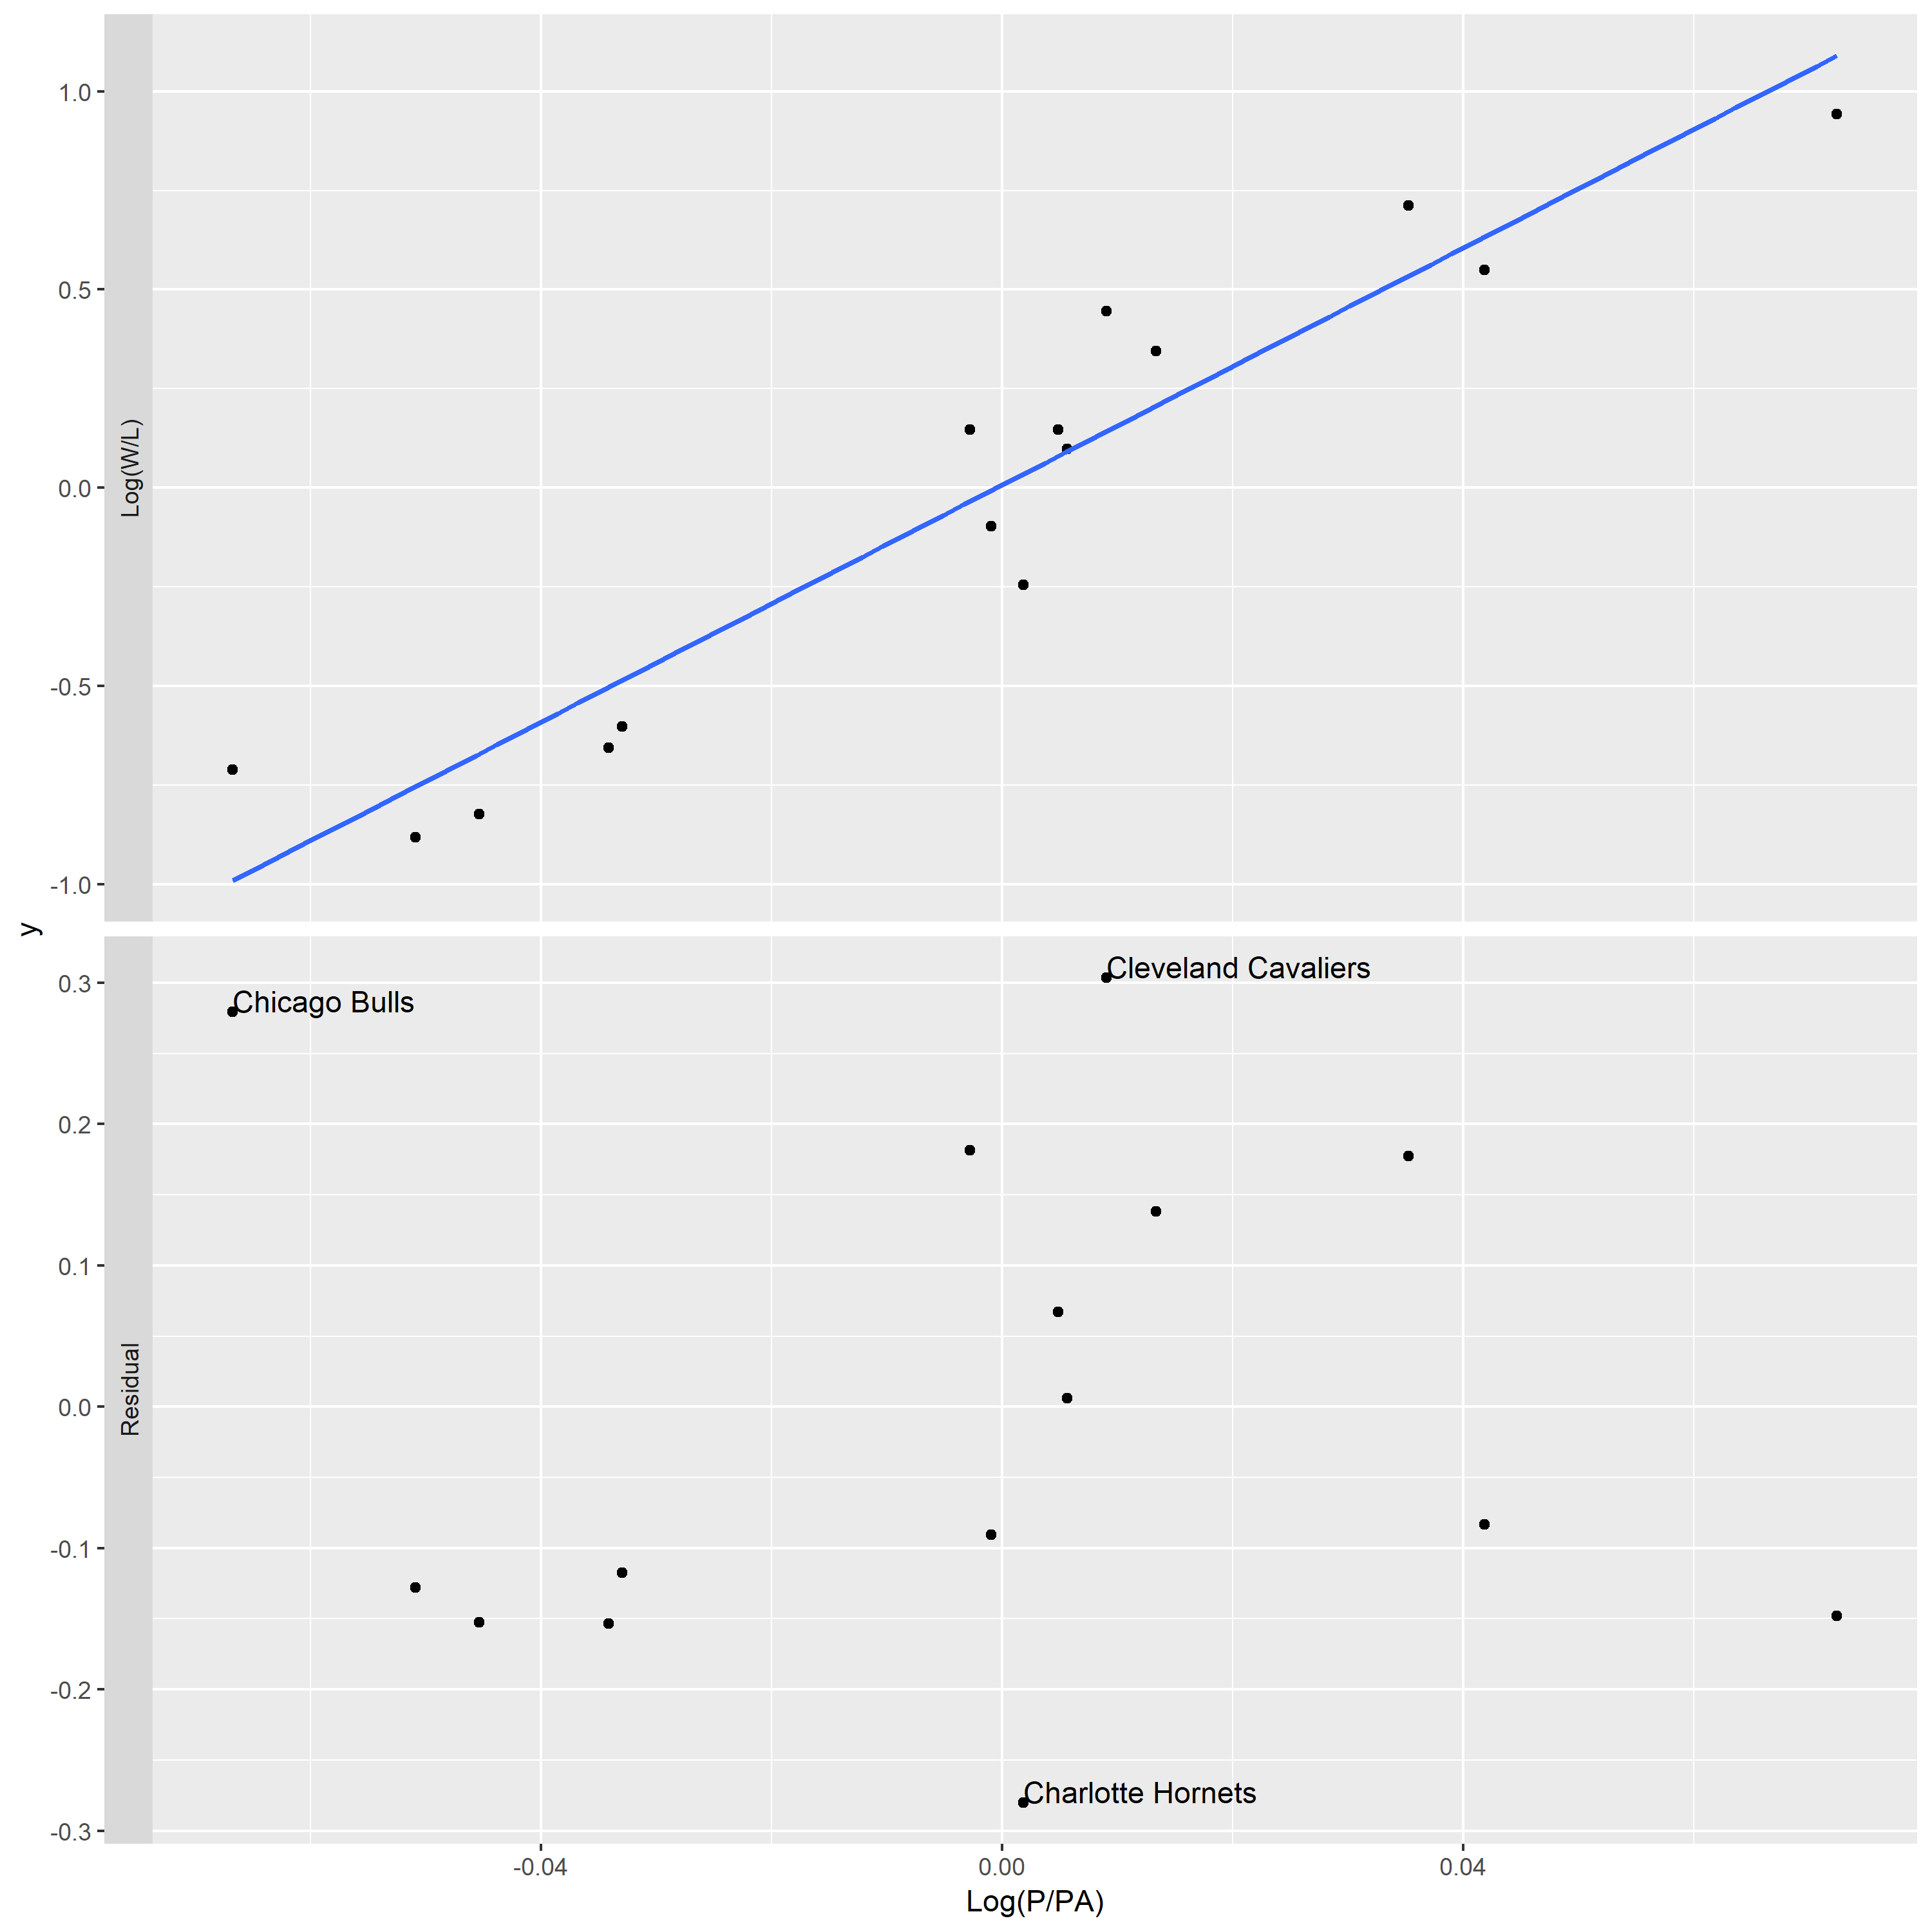
In the top panel of plot, the overall pattern of data follow a trend that Log(W/L) goes up when Log(P/PA) increase. But it is hard to assess the residuals since the points of the plot lie in a narrow band around the line. Then, based on the bottom panel of plot, the percent deviations of the actual Log(W/L) from the ideal ones range between about -20% and 20%.
In the top panel of above figure, the fitting line go through point (0,0) and point (0.04,0.12). So, the best fitting choice of k is 3.
The unusual teams are Chicago Bulls, Cleveland Cavaliers, and Charlotte Hornets. In my opinion, Chicago Bulls is lucky teams, since they win games with smaller points scored by their team.