The simulated data (x,y) where the true signal follows one of the curves
Curve 1: sin(x) + cos(x),
Curve 2: sin(x) – cos(x),
Curve 3: sin(x) * cos(x),
Curve 4: .28 – .88 * x – 0.03 * x^2 + .14 * x^3.
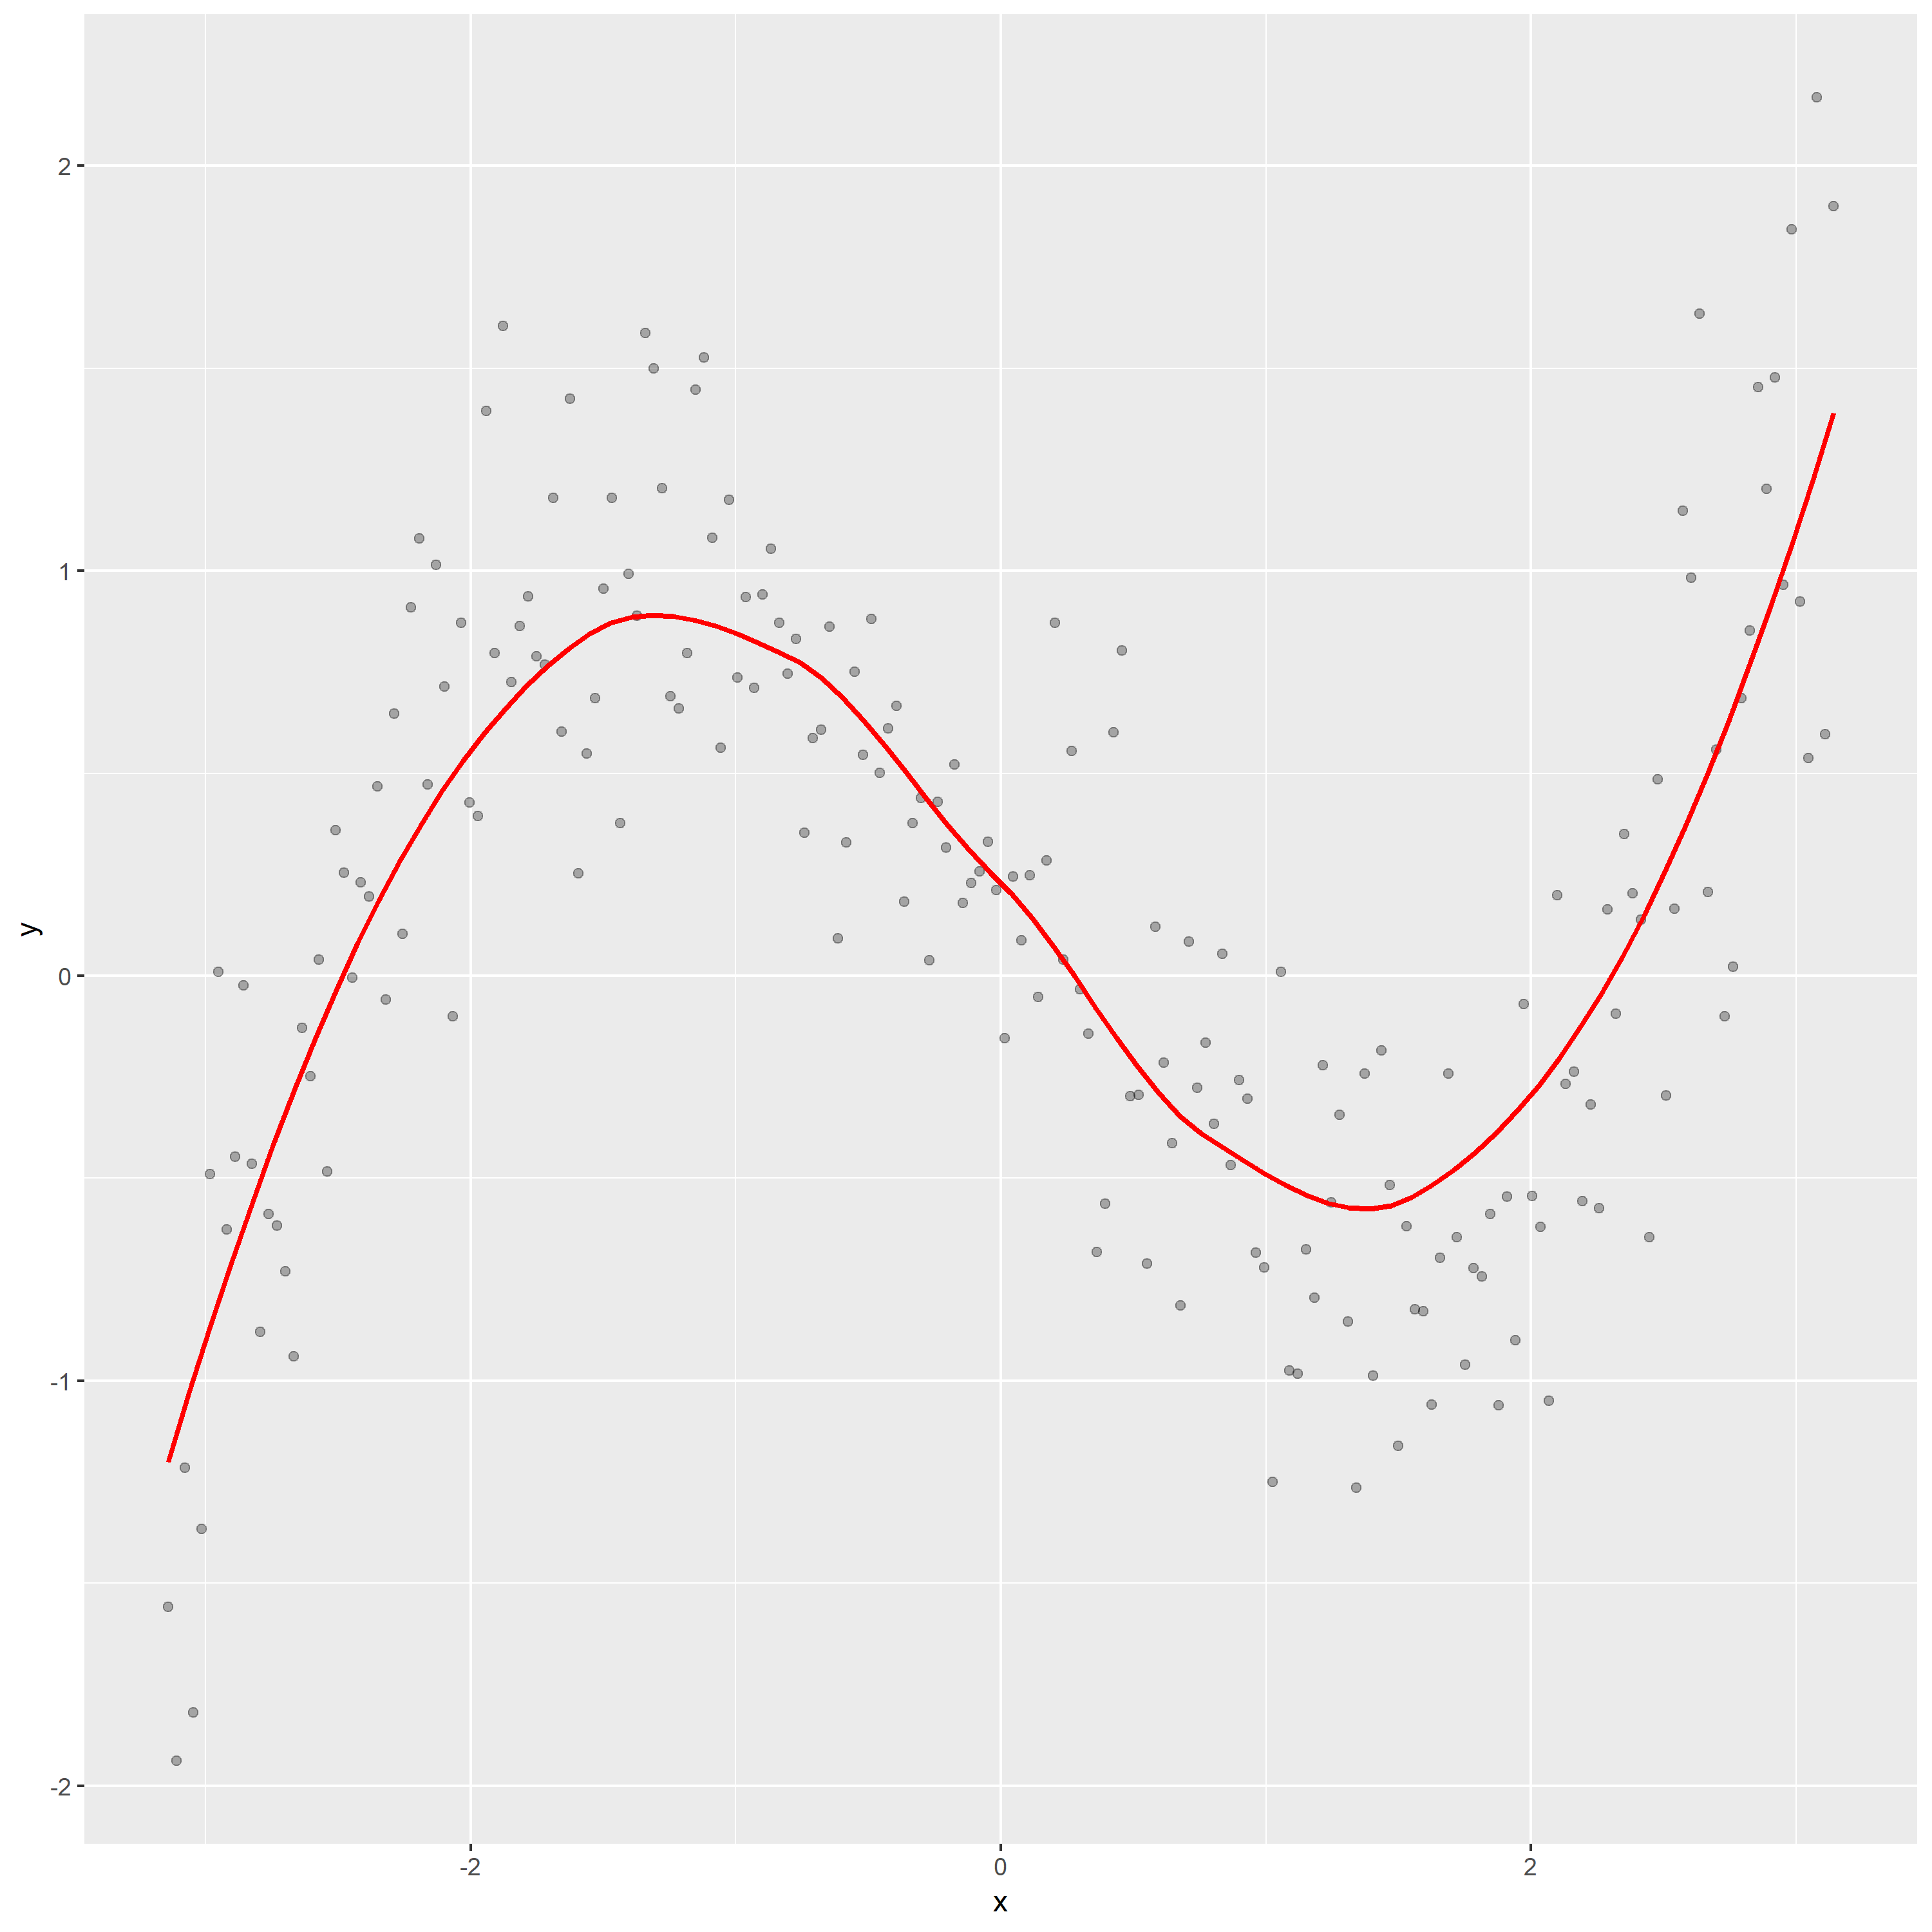
1.Construct a scatterplot of the simulated data and overlay a loess smooth.

In above graph, the loess curve shows that the relation between y and x is nonlinear. According to the overall shape of loess curve, it seems like the curve 4, which indicates that the response y follow this curve: .28 – .88 * x – 0.03 * x^2 + .14 * x^3.
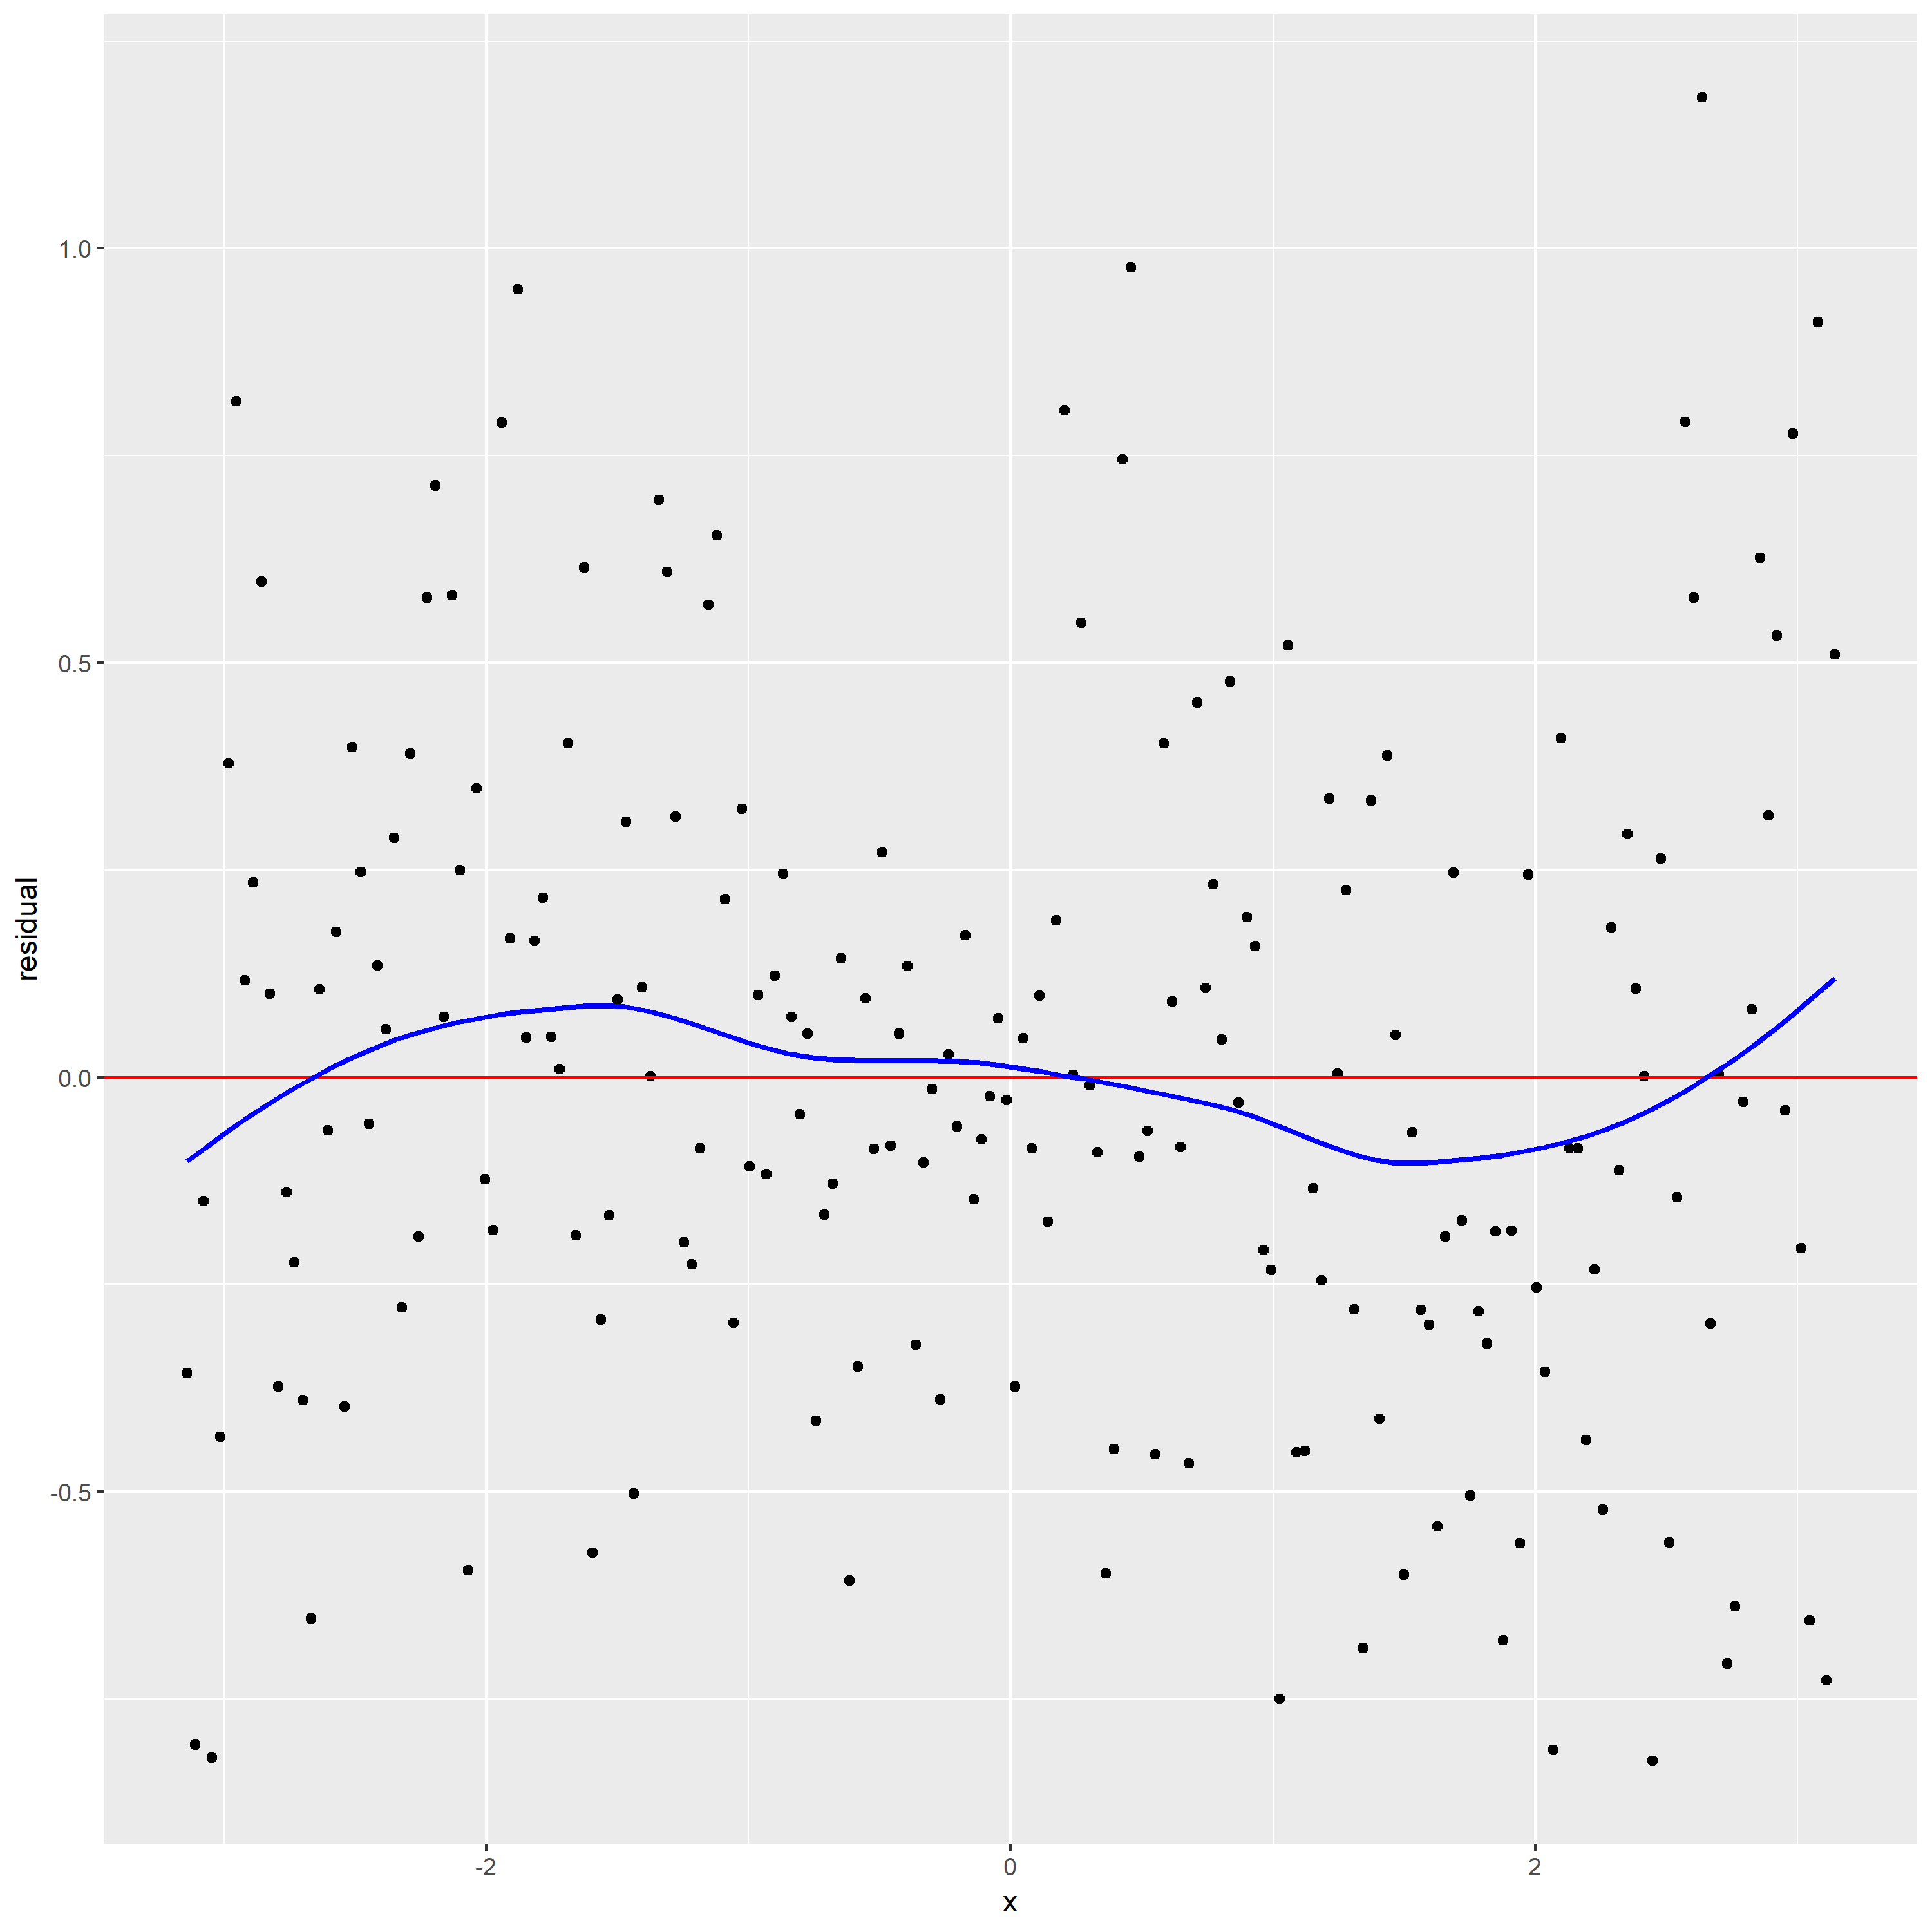
2.Construct a plot of residuals and comments

From the residual graph with loess curve superposed, the loess curve is not a horizontal line, which suggests there is a dependence of the residuals on x. It indicates alpha maybe too large leading loess smoothing has missed part of the pattern.
The loess curve in scatterplot has effectively found the signal. But the loess curve in residual graph does not have effectively found the signal.
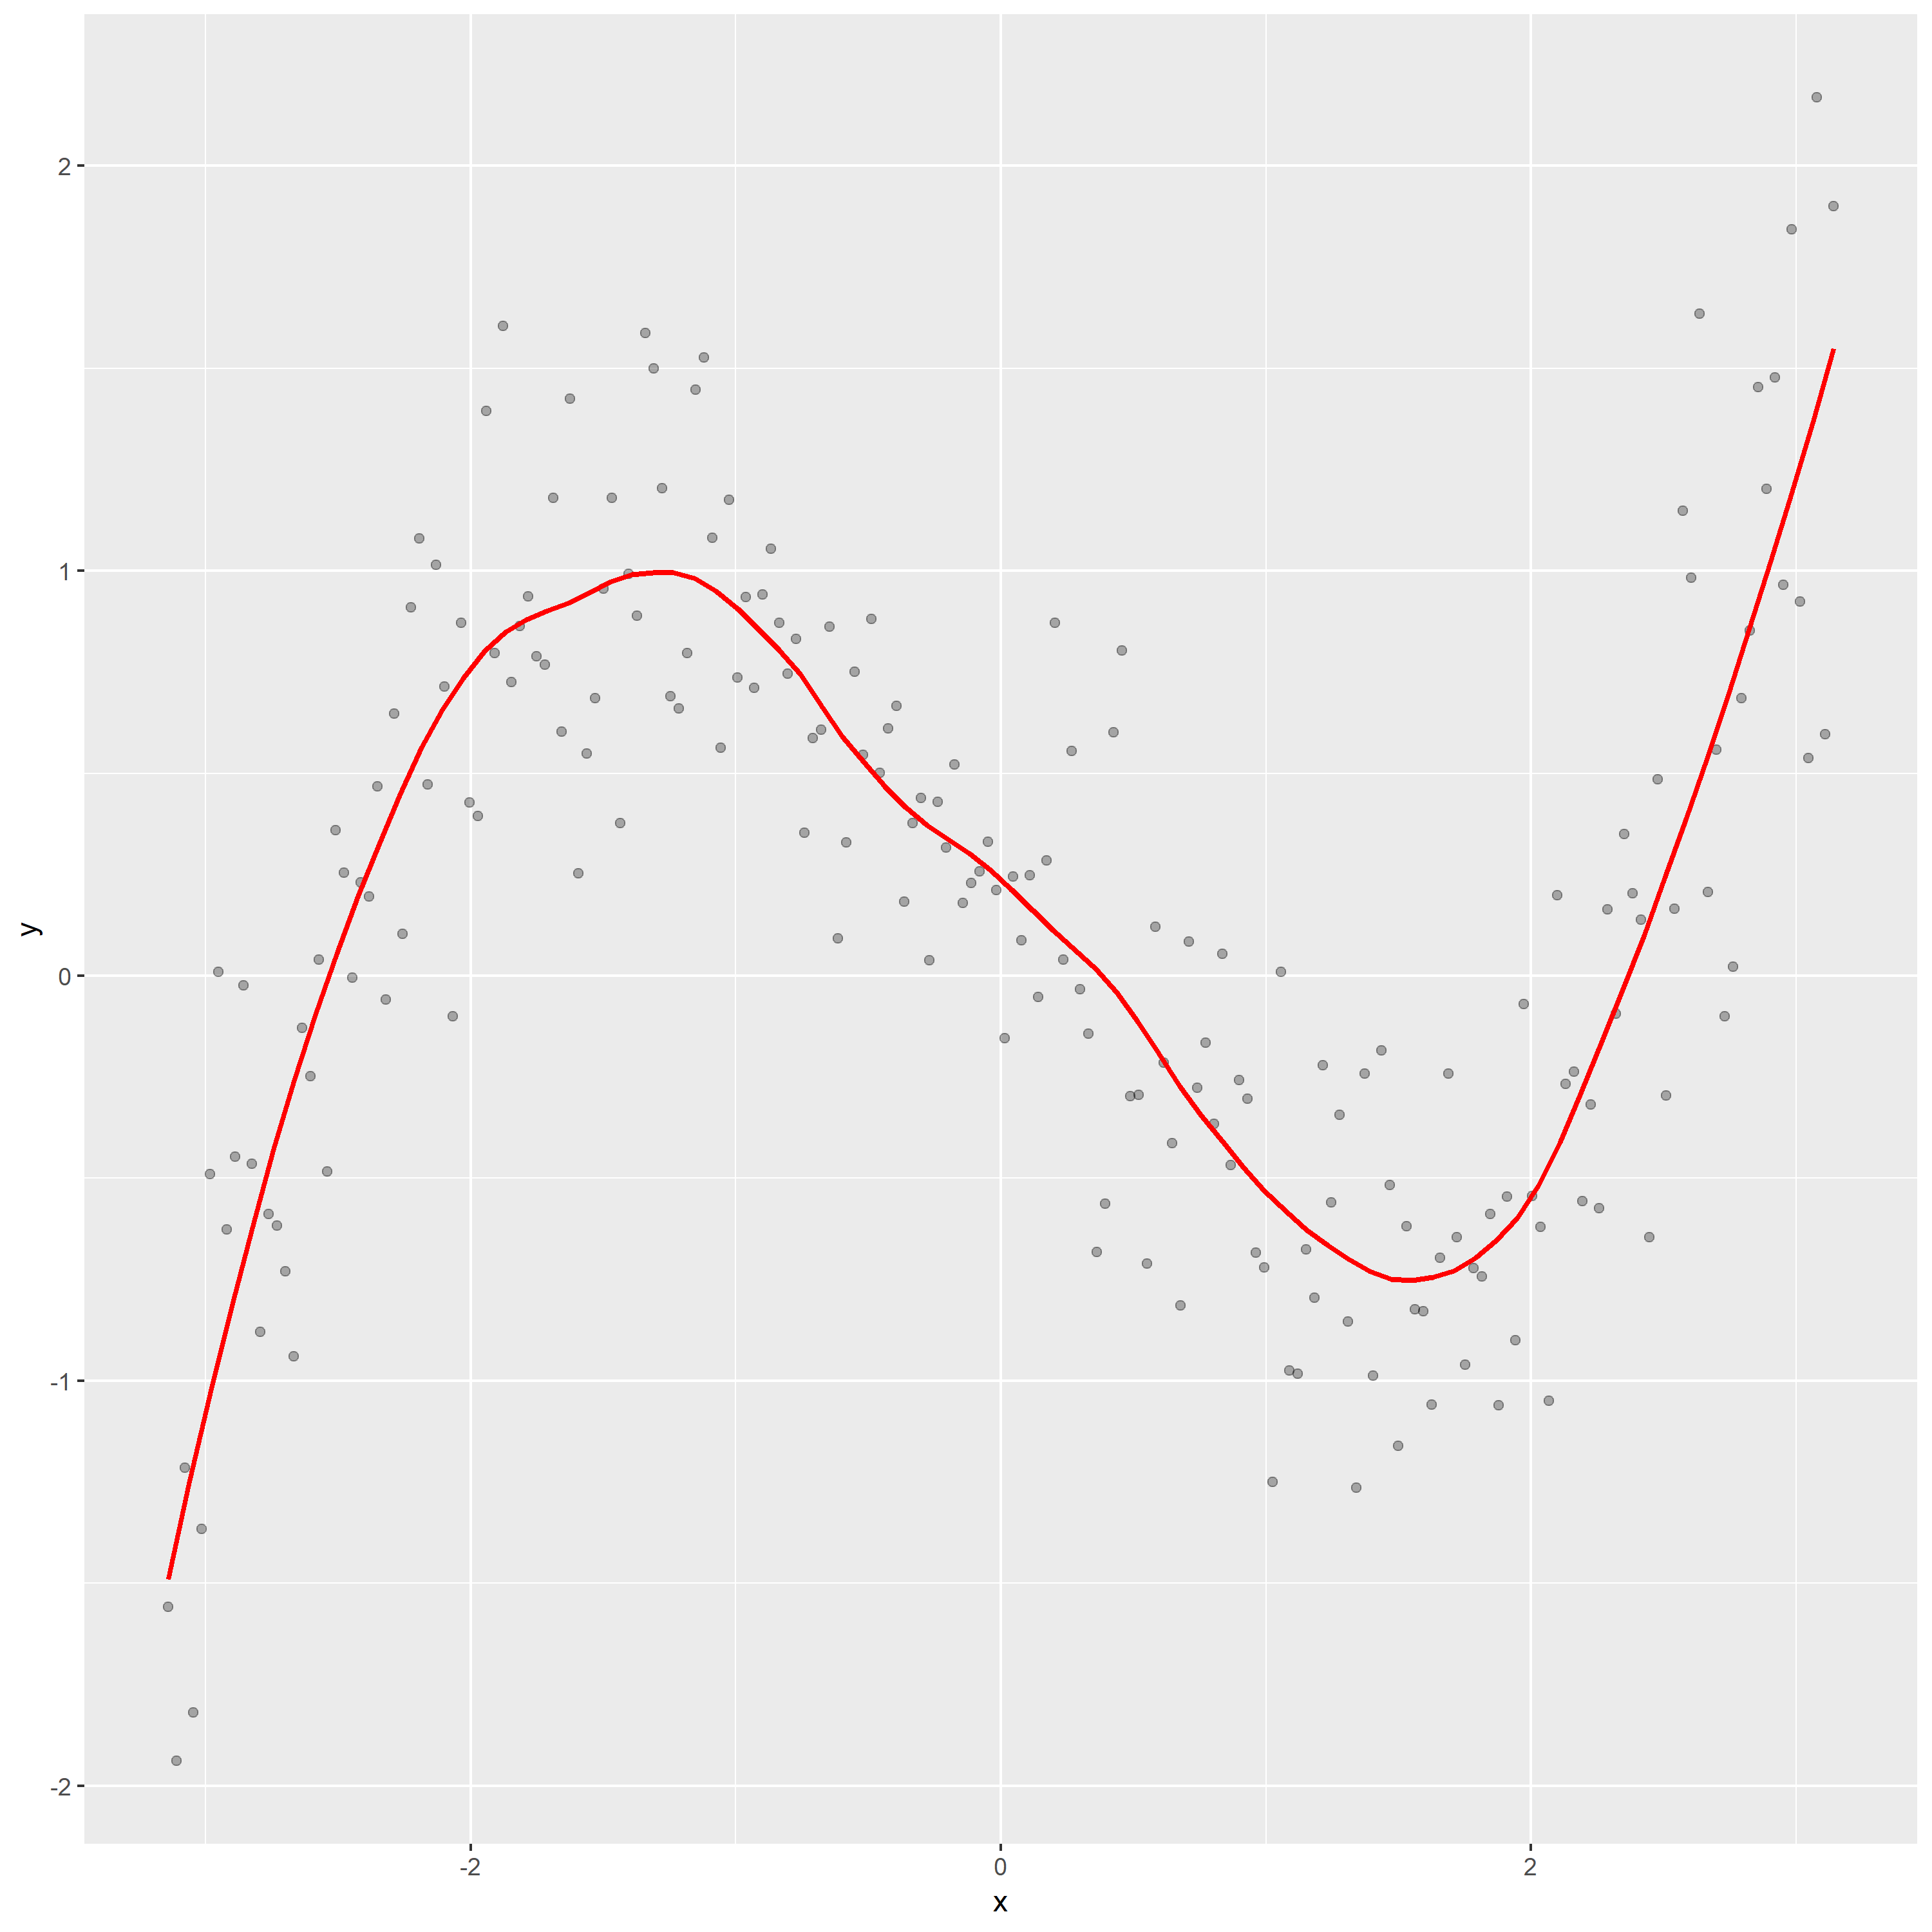
3. Use better loess smoothing parameter draw scatter plot and residual plot.
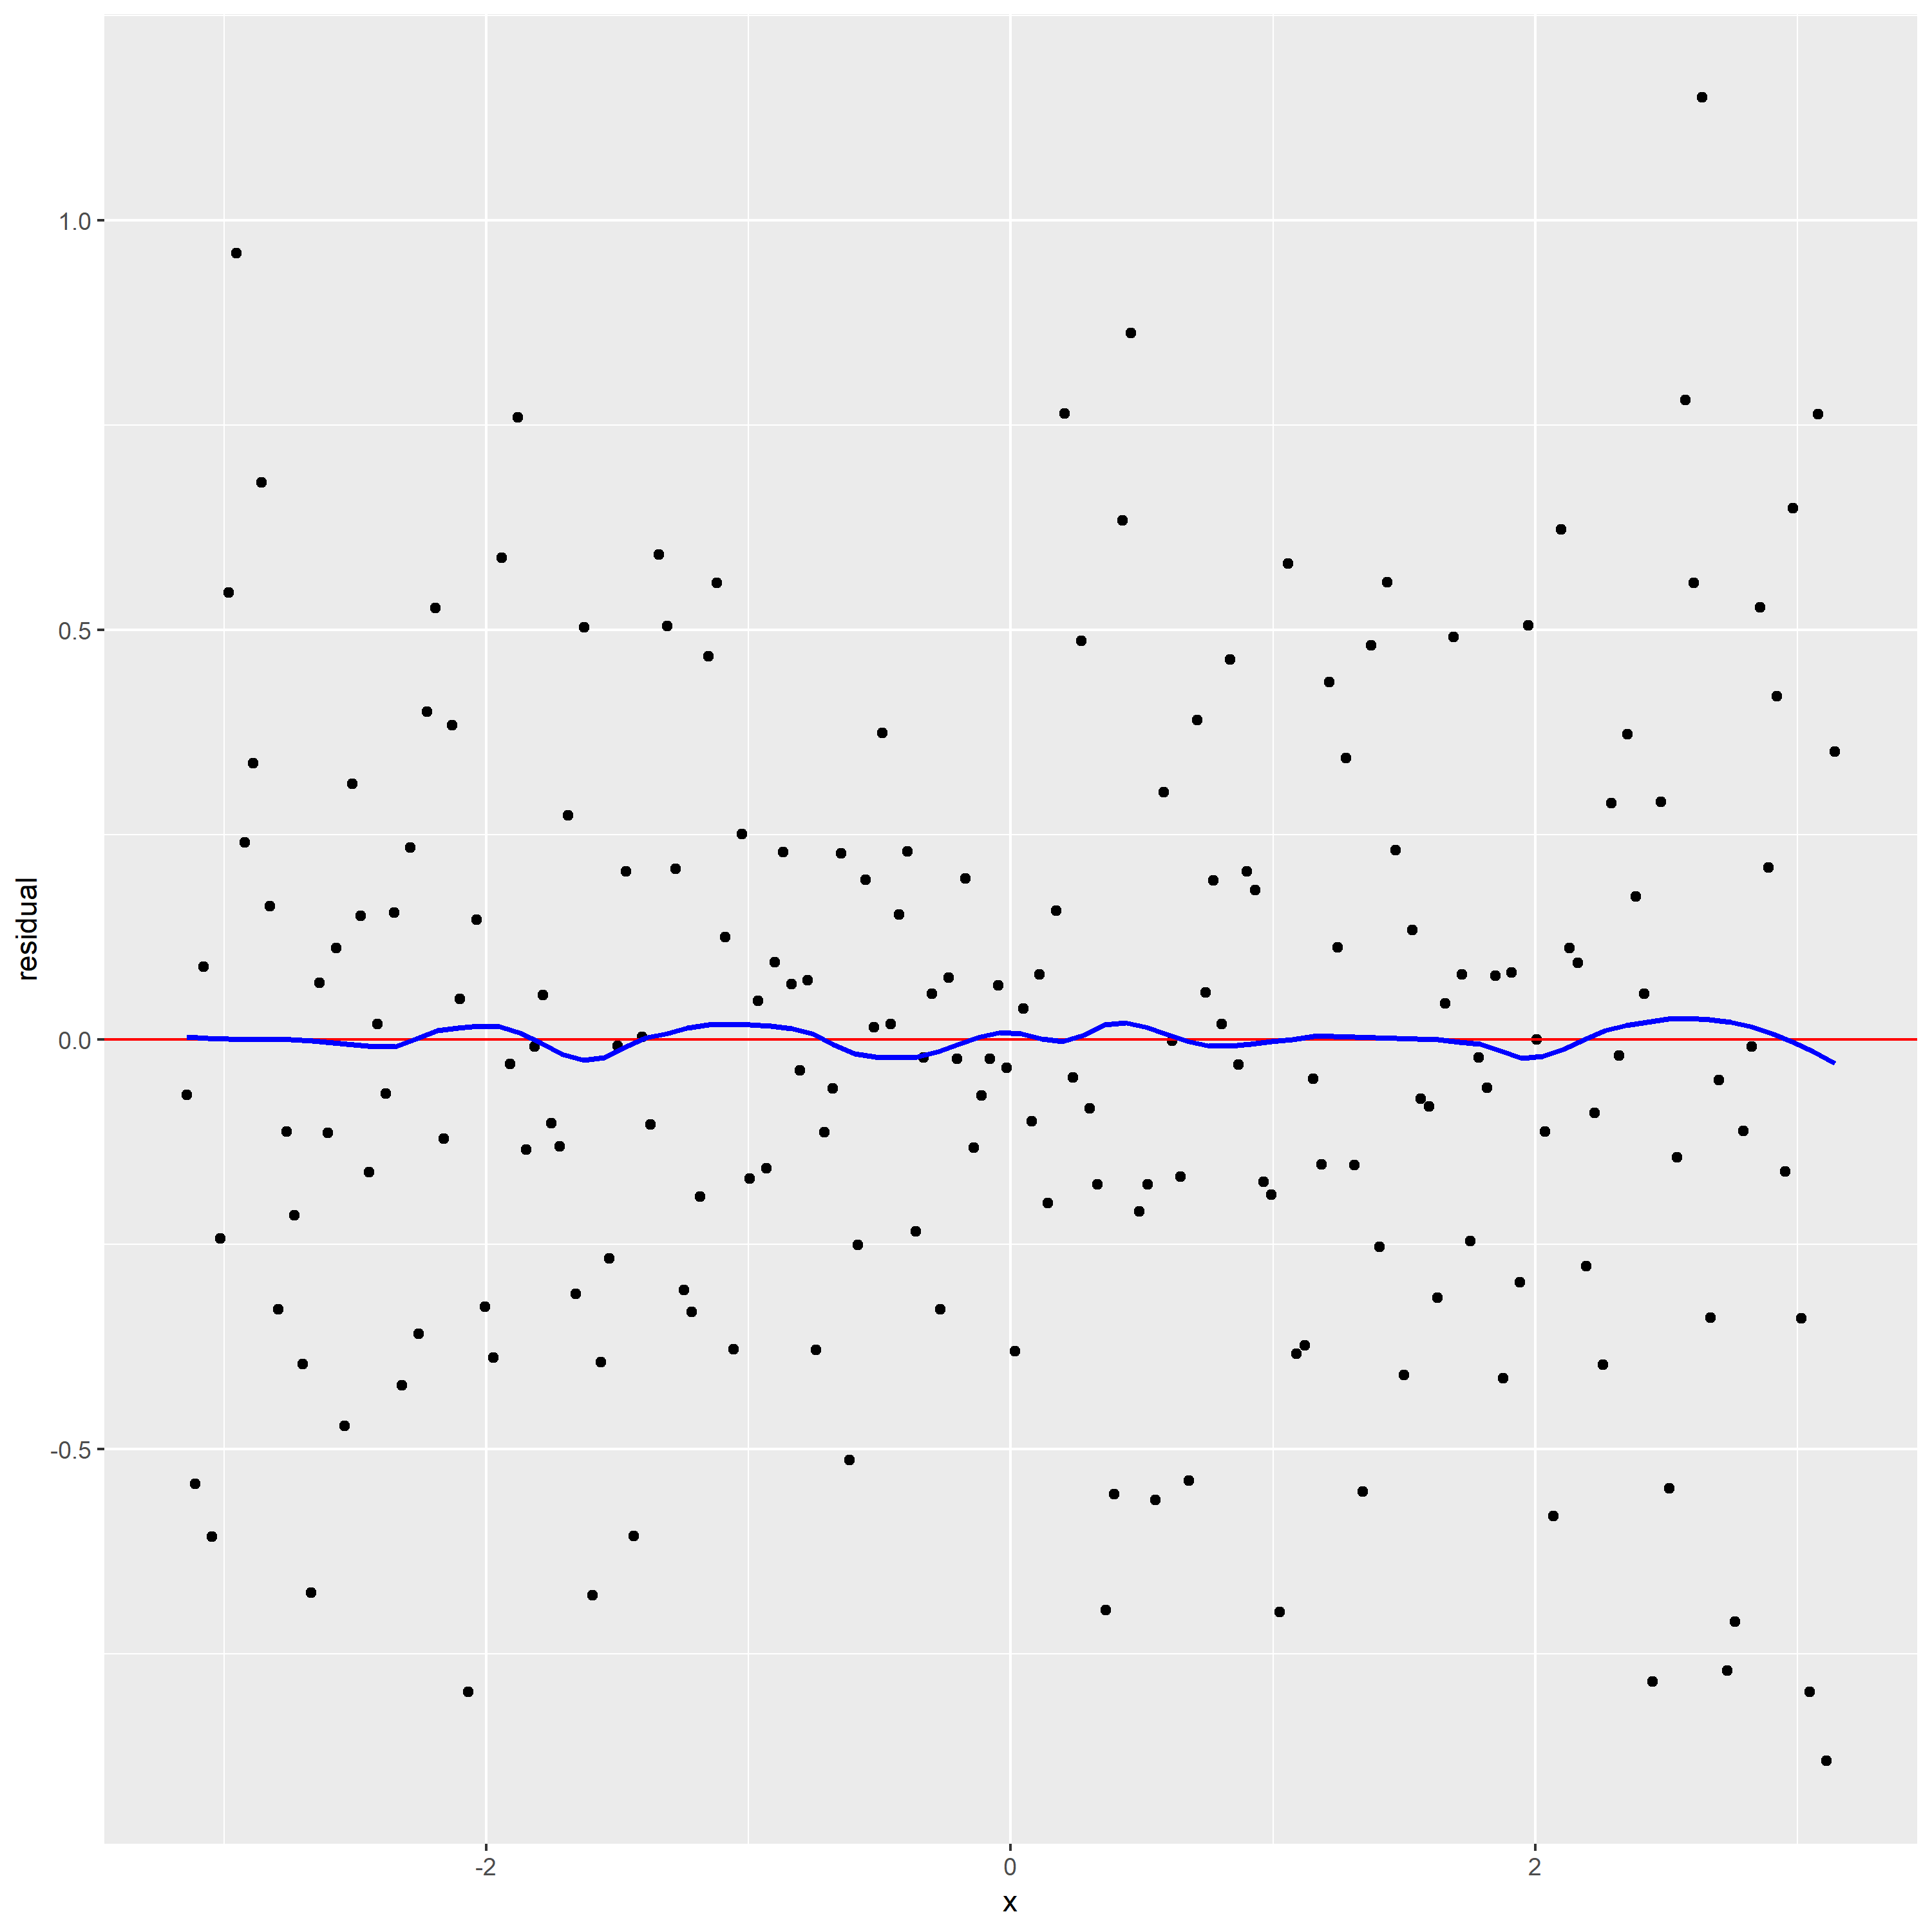
For this time, I choose span=0.3. The top one is scatter plot, the bottom panel is residual graph.


From the residual graph, the loess curve is nearly a horizontal line, which shows no dependence of the residuals on x. It also indicates that the loess curve with alpha=0.3 is not distorting the underlying pattern.
Then, according to the new scatterplot, I think f is .28 – .88 * x – 0.03 * x^2 + .14 * x^3 (curve 4) since the pattern seems like the curve 4. And for this time, we eliminate the problem that x effect the residual since the loess smoothing parameter is too large.