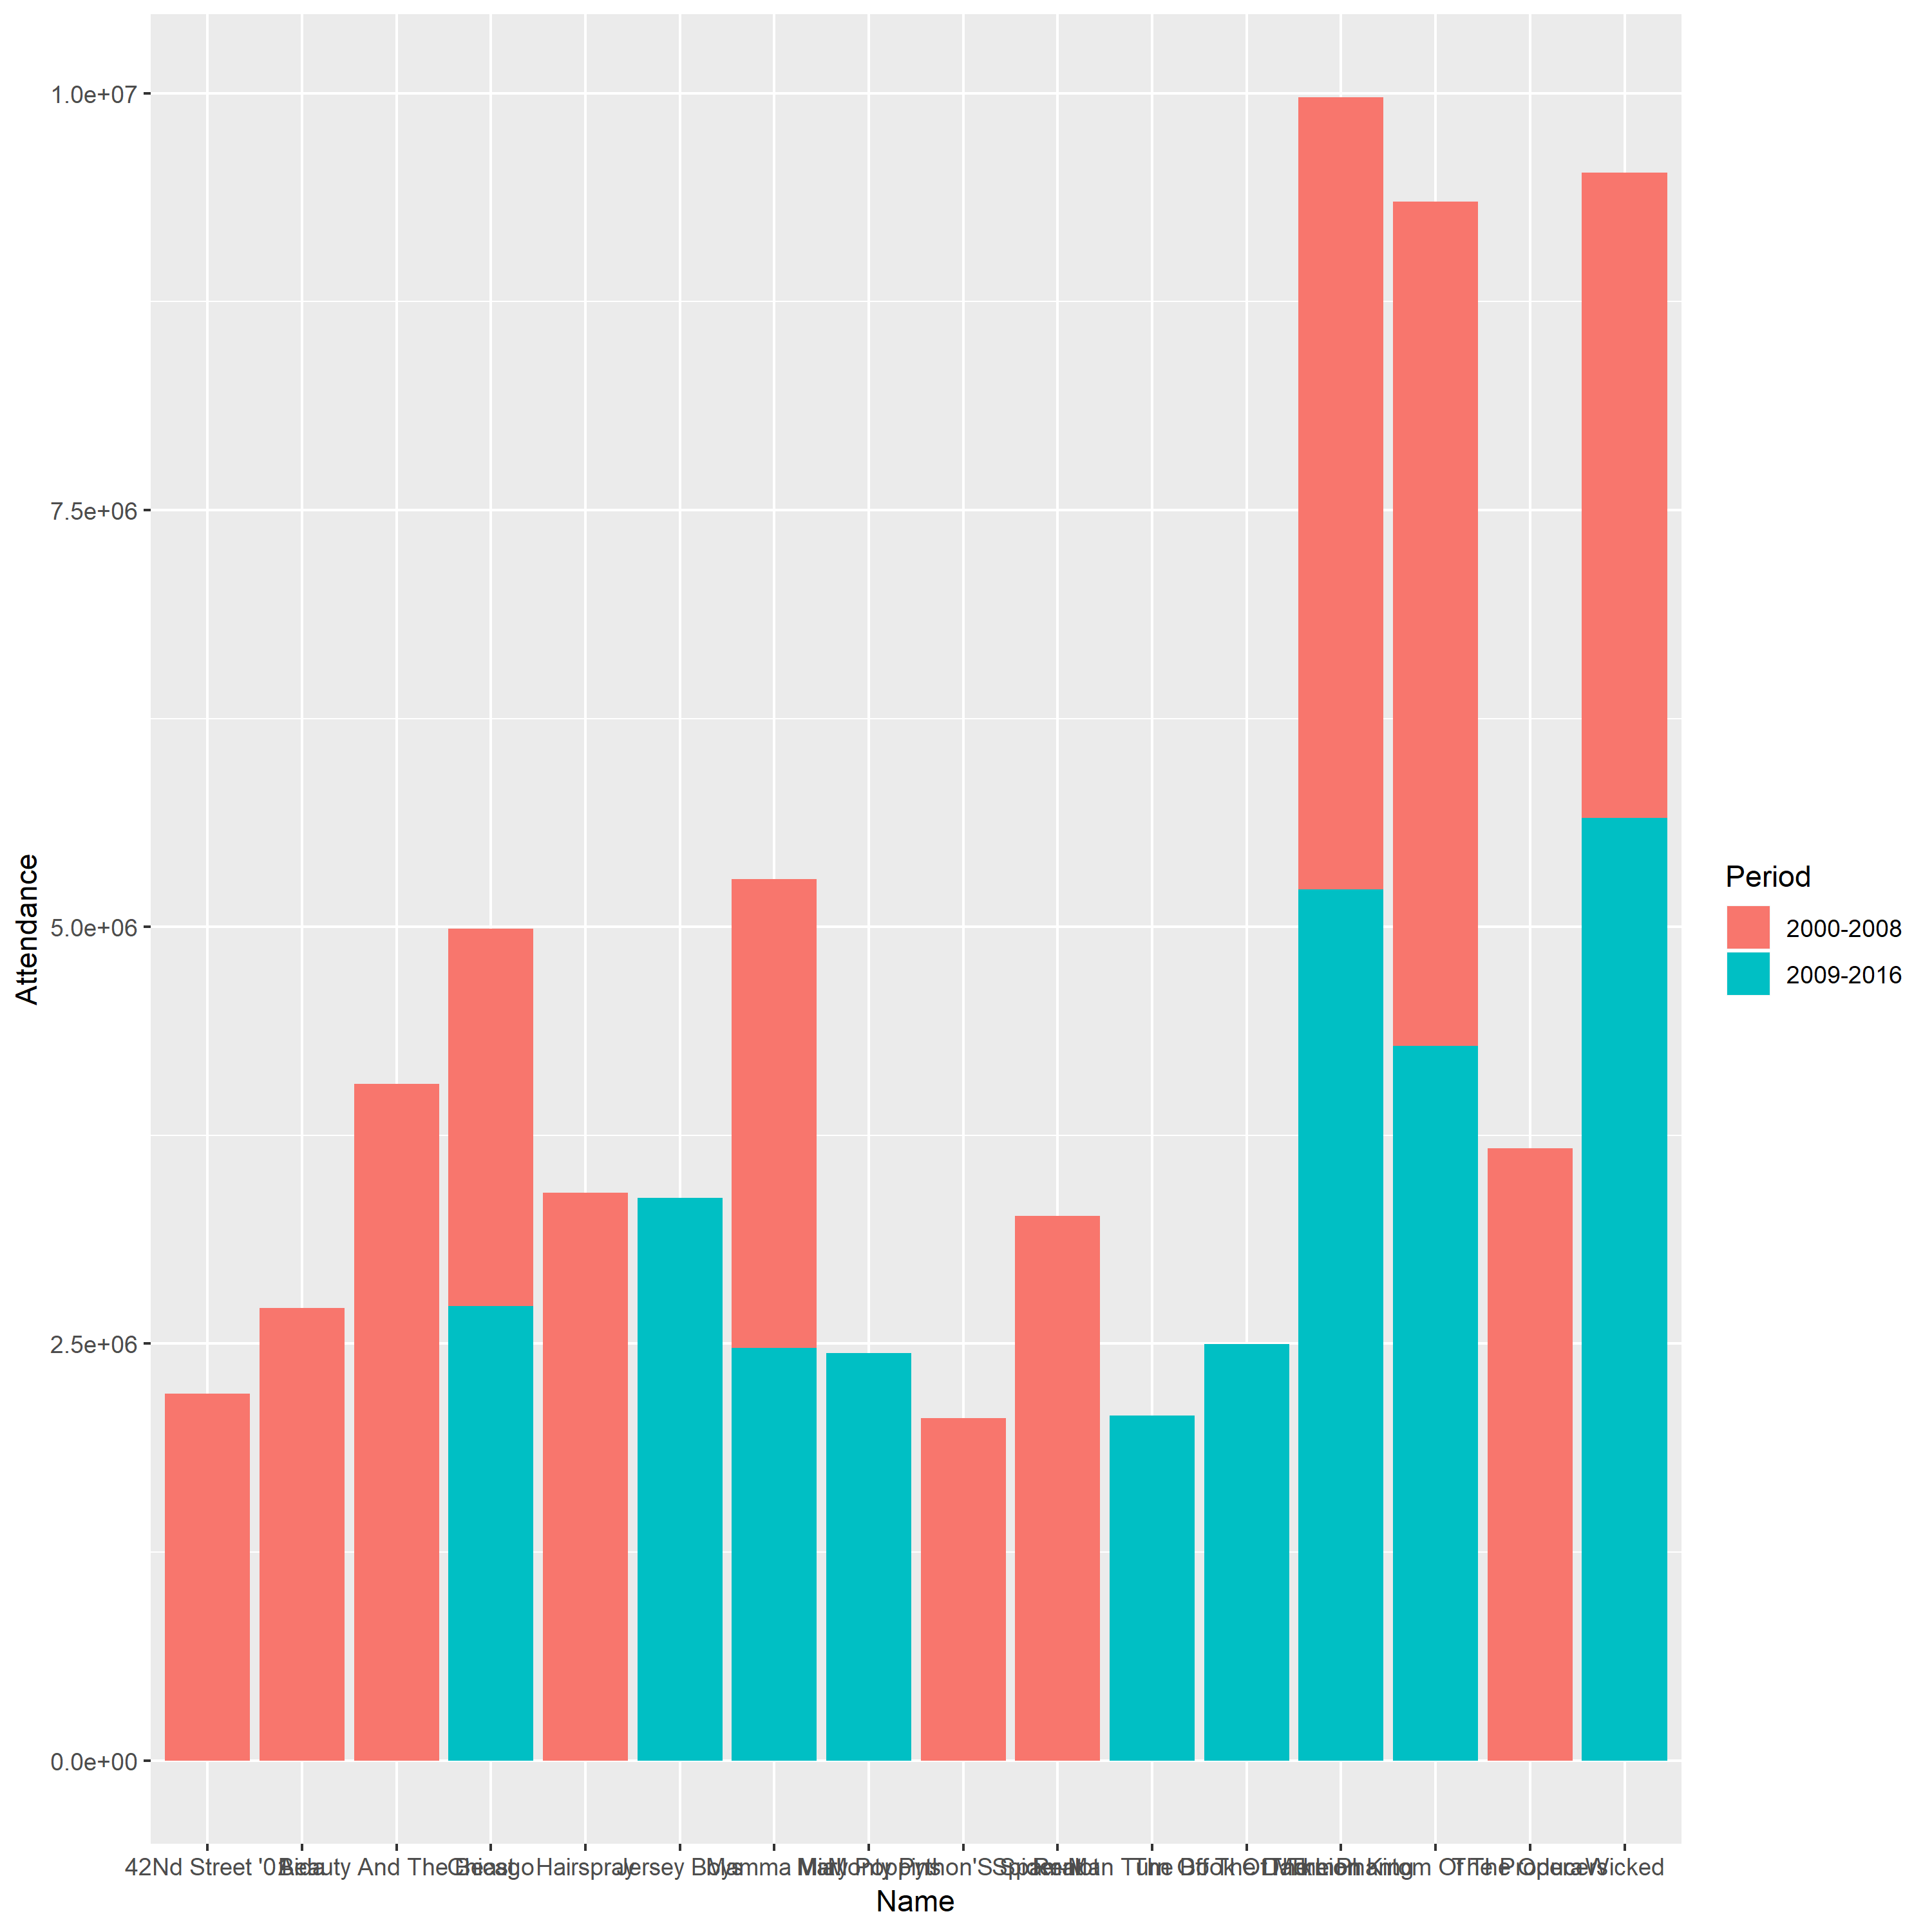
The first stacked bar plot

Problem
1.The bars of this plot are arranged arbitrarily, which make the figure become more confusing and less intuitive.
2.The labels of each bar cannot be discerned since them take up a lot of horizontal space.
3.The vertical scale line does not have detailed description and this plot does not have descriptive title.
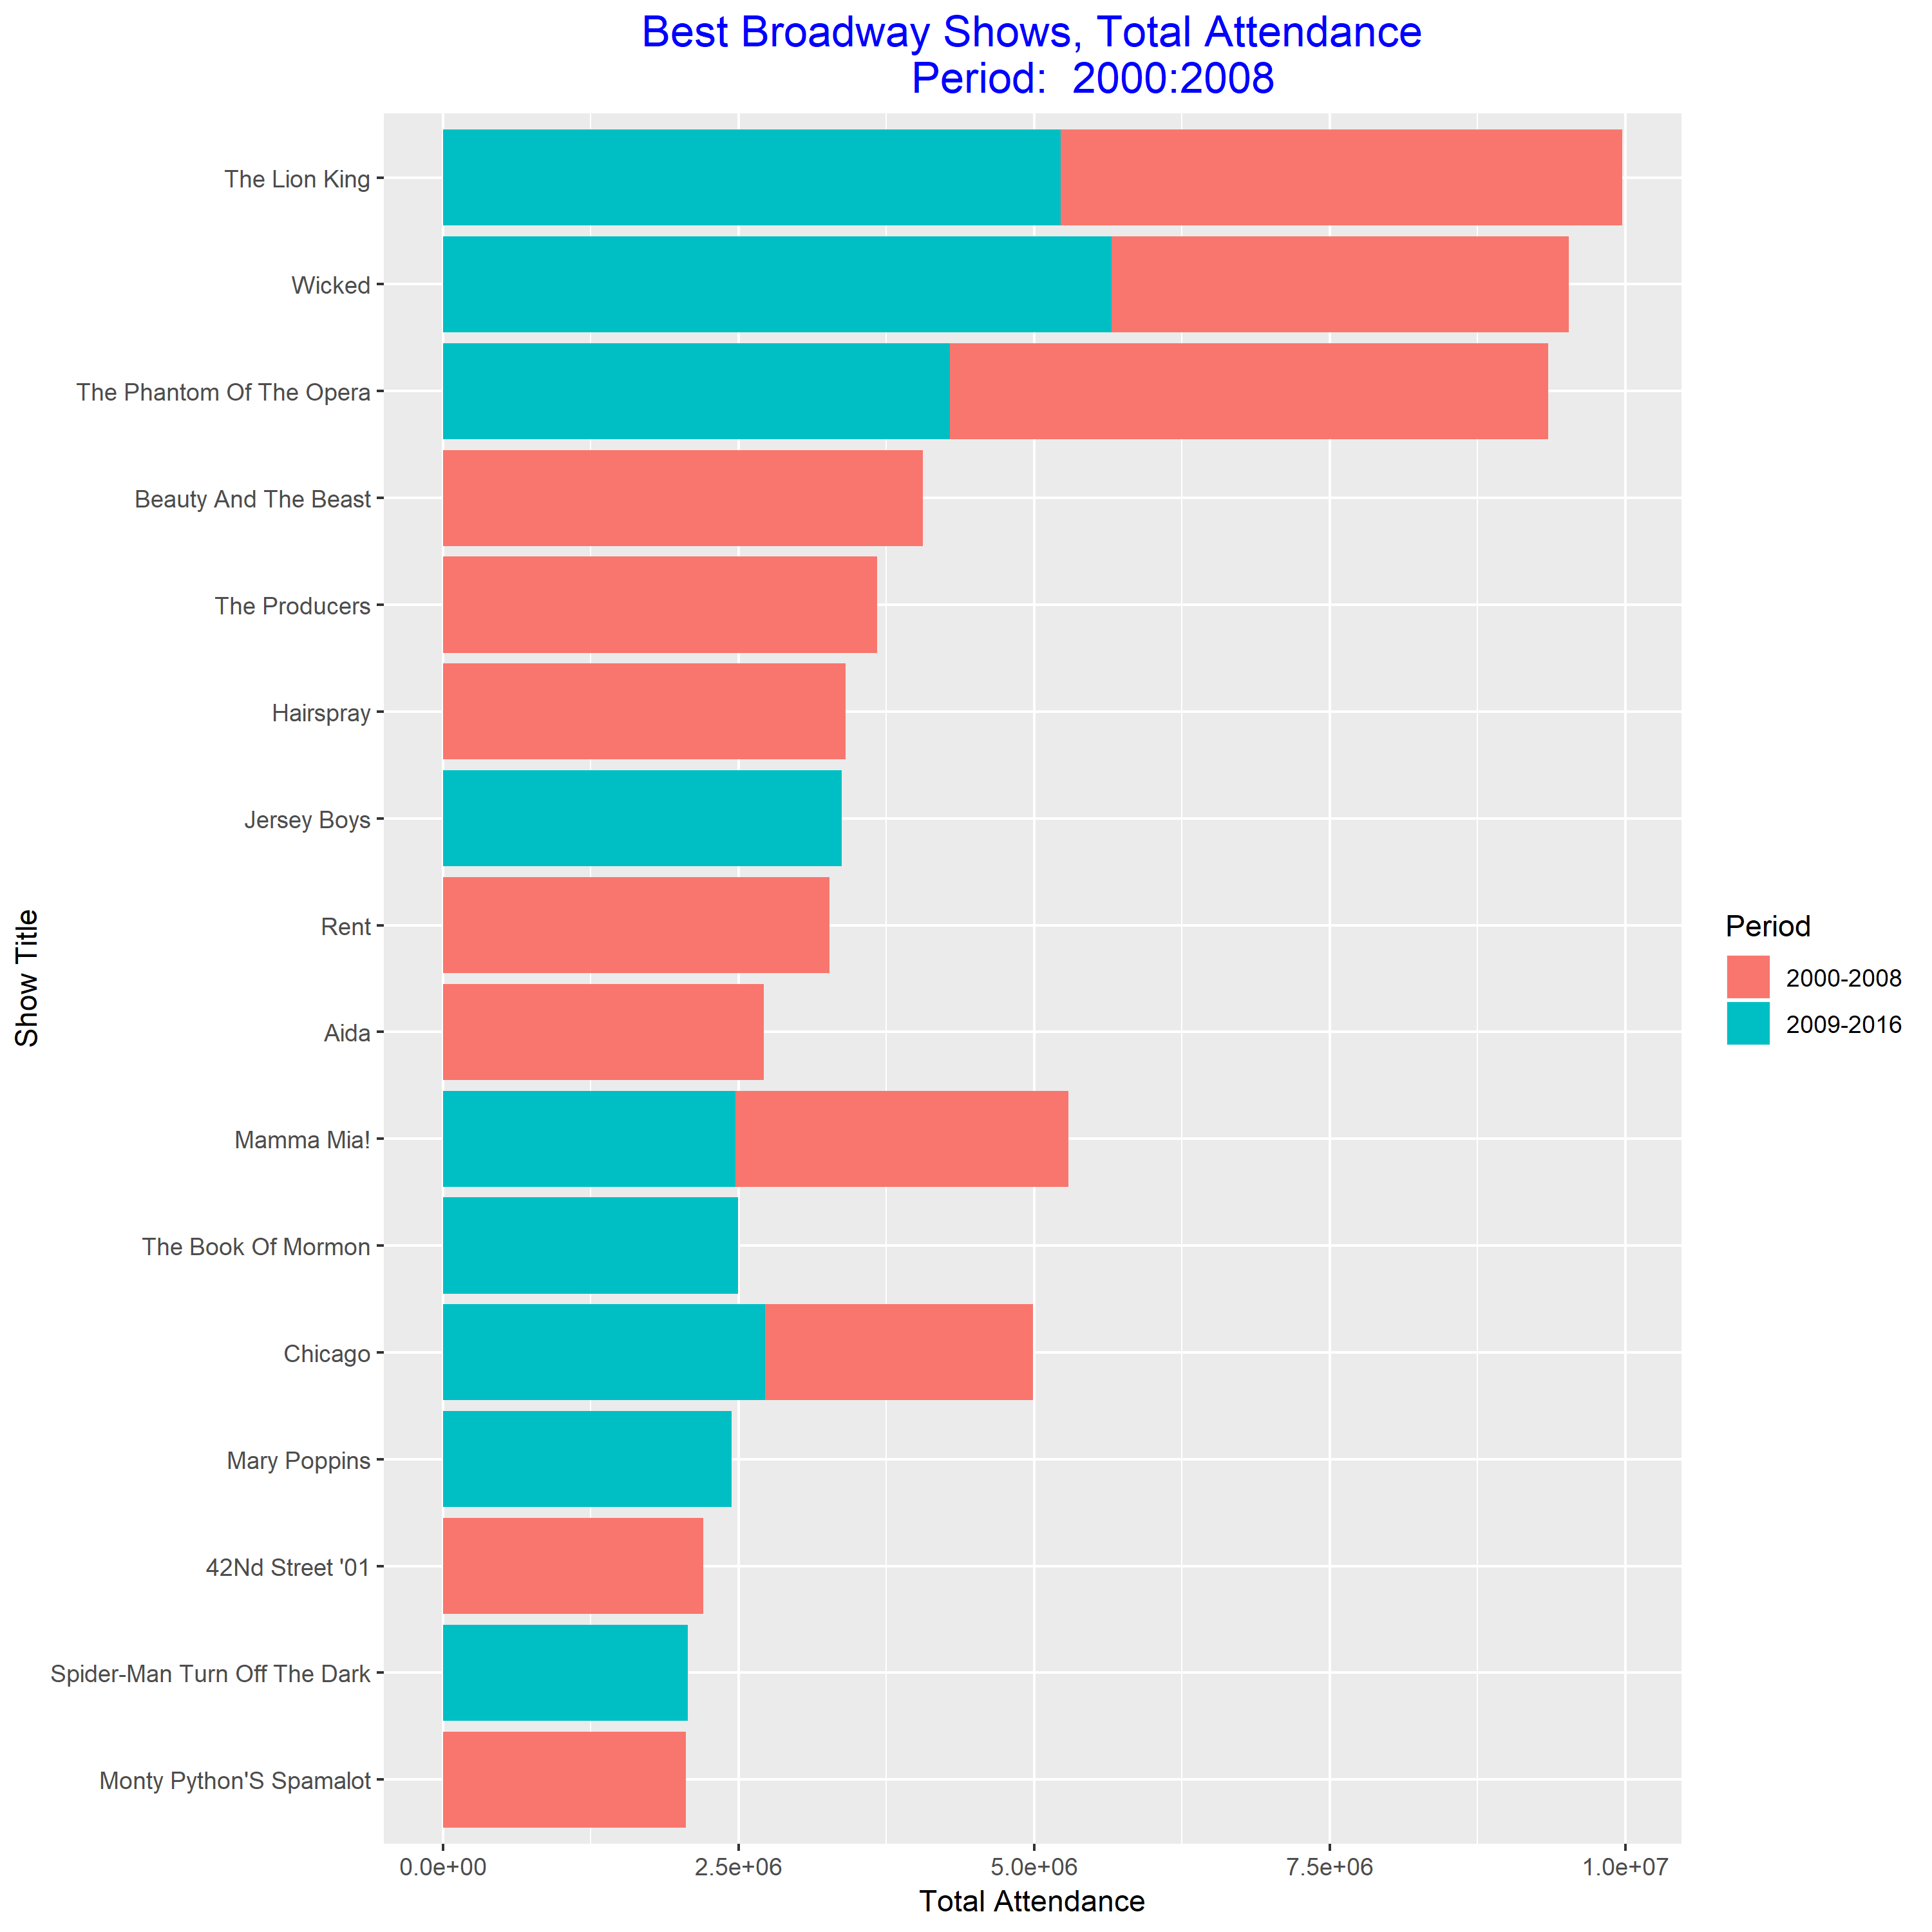
The improved stacked bar plot

This plot is much easier to read than the previous one. From this plot, we know that “Wicked” is the best show during 2009-2016, and “The Phantom of the Opera” is the best show during 2000-2008. And “Wicked” become more and more popular.
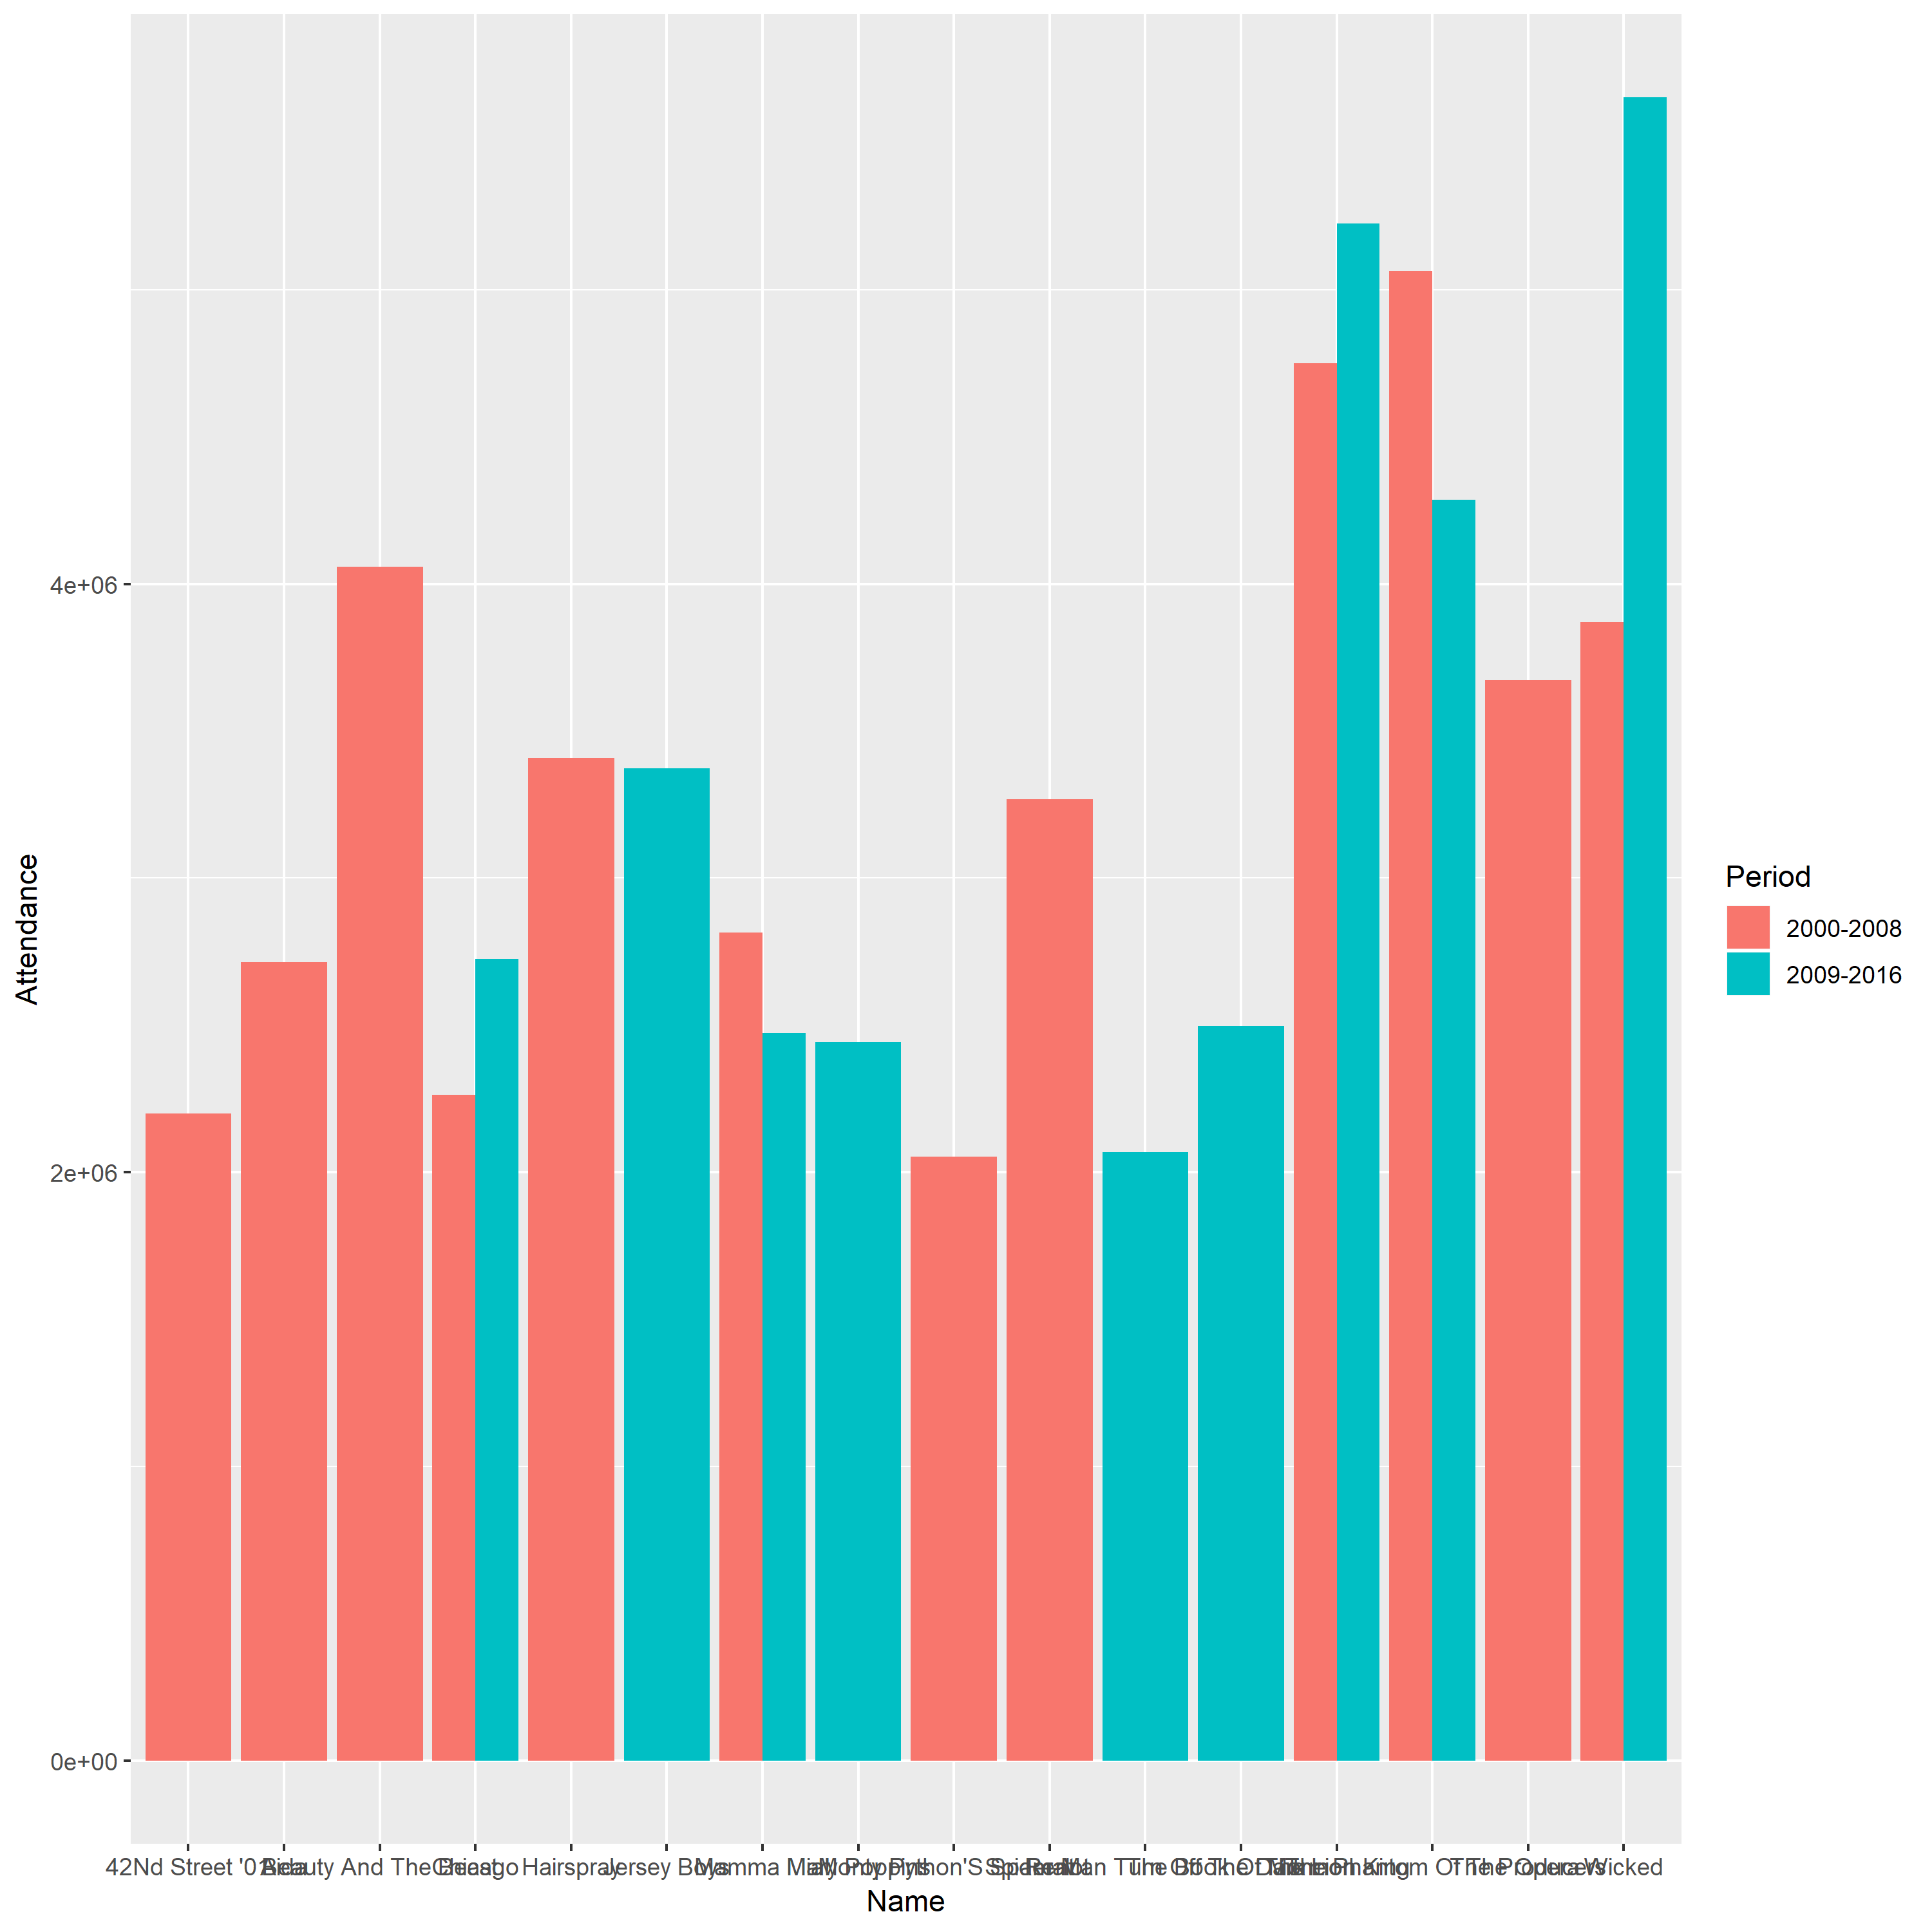
The first grouped bar plot

Problem
1.The bars of this plot are arranged arbitrarily, which make the figure become more confusing and less intuitive.
2.The labels of each bar cannot be discerned since them take up a lot of horizontal space.
3.The vertical scale line does not have detailed description and this plot does not have descriptive title.
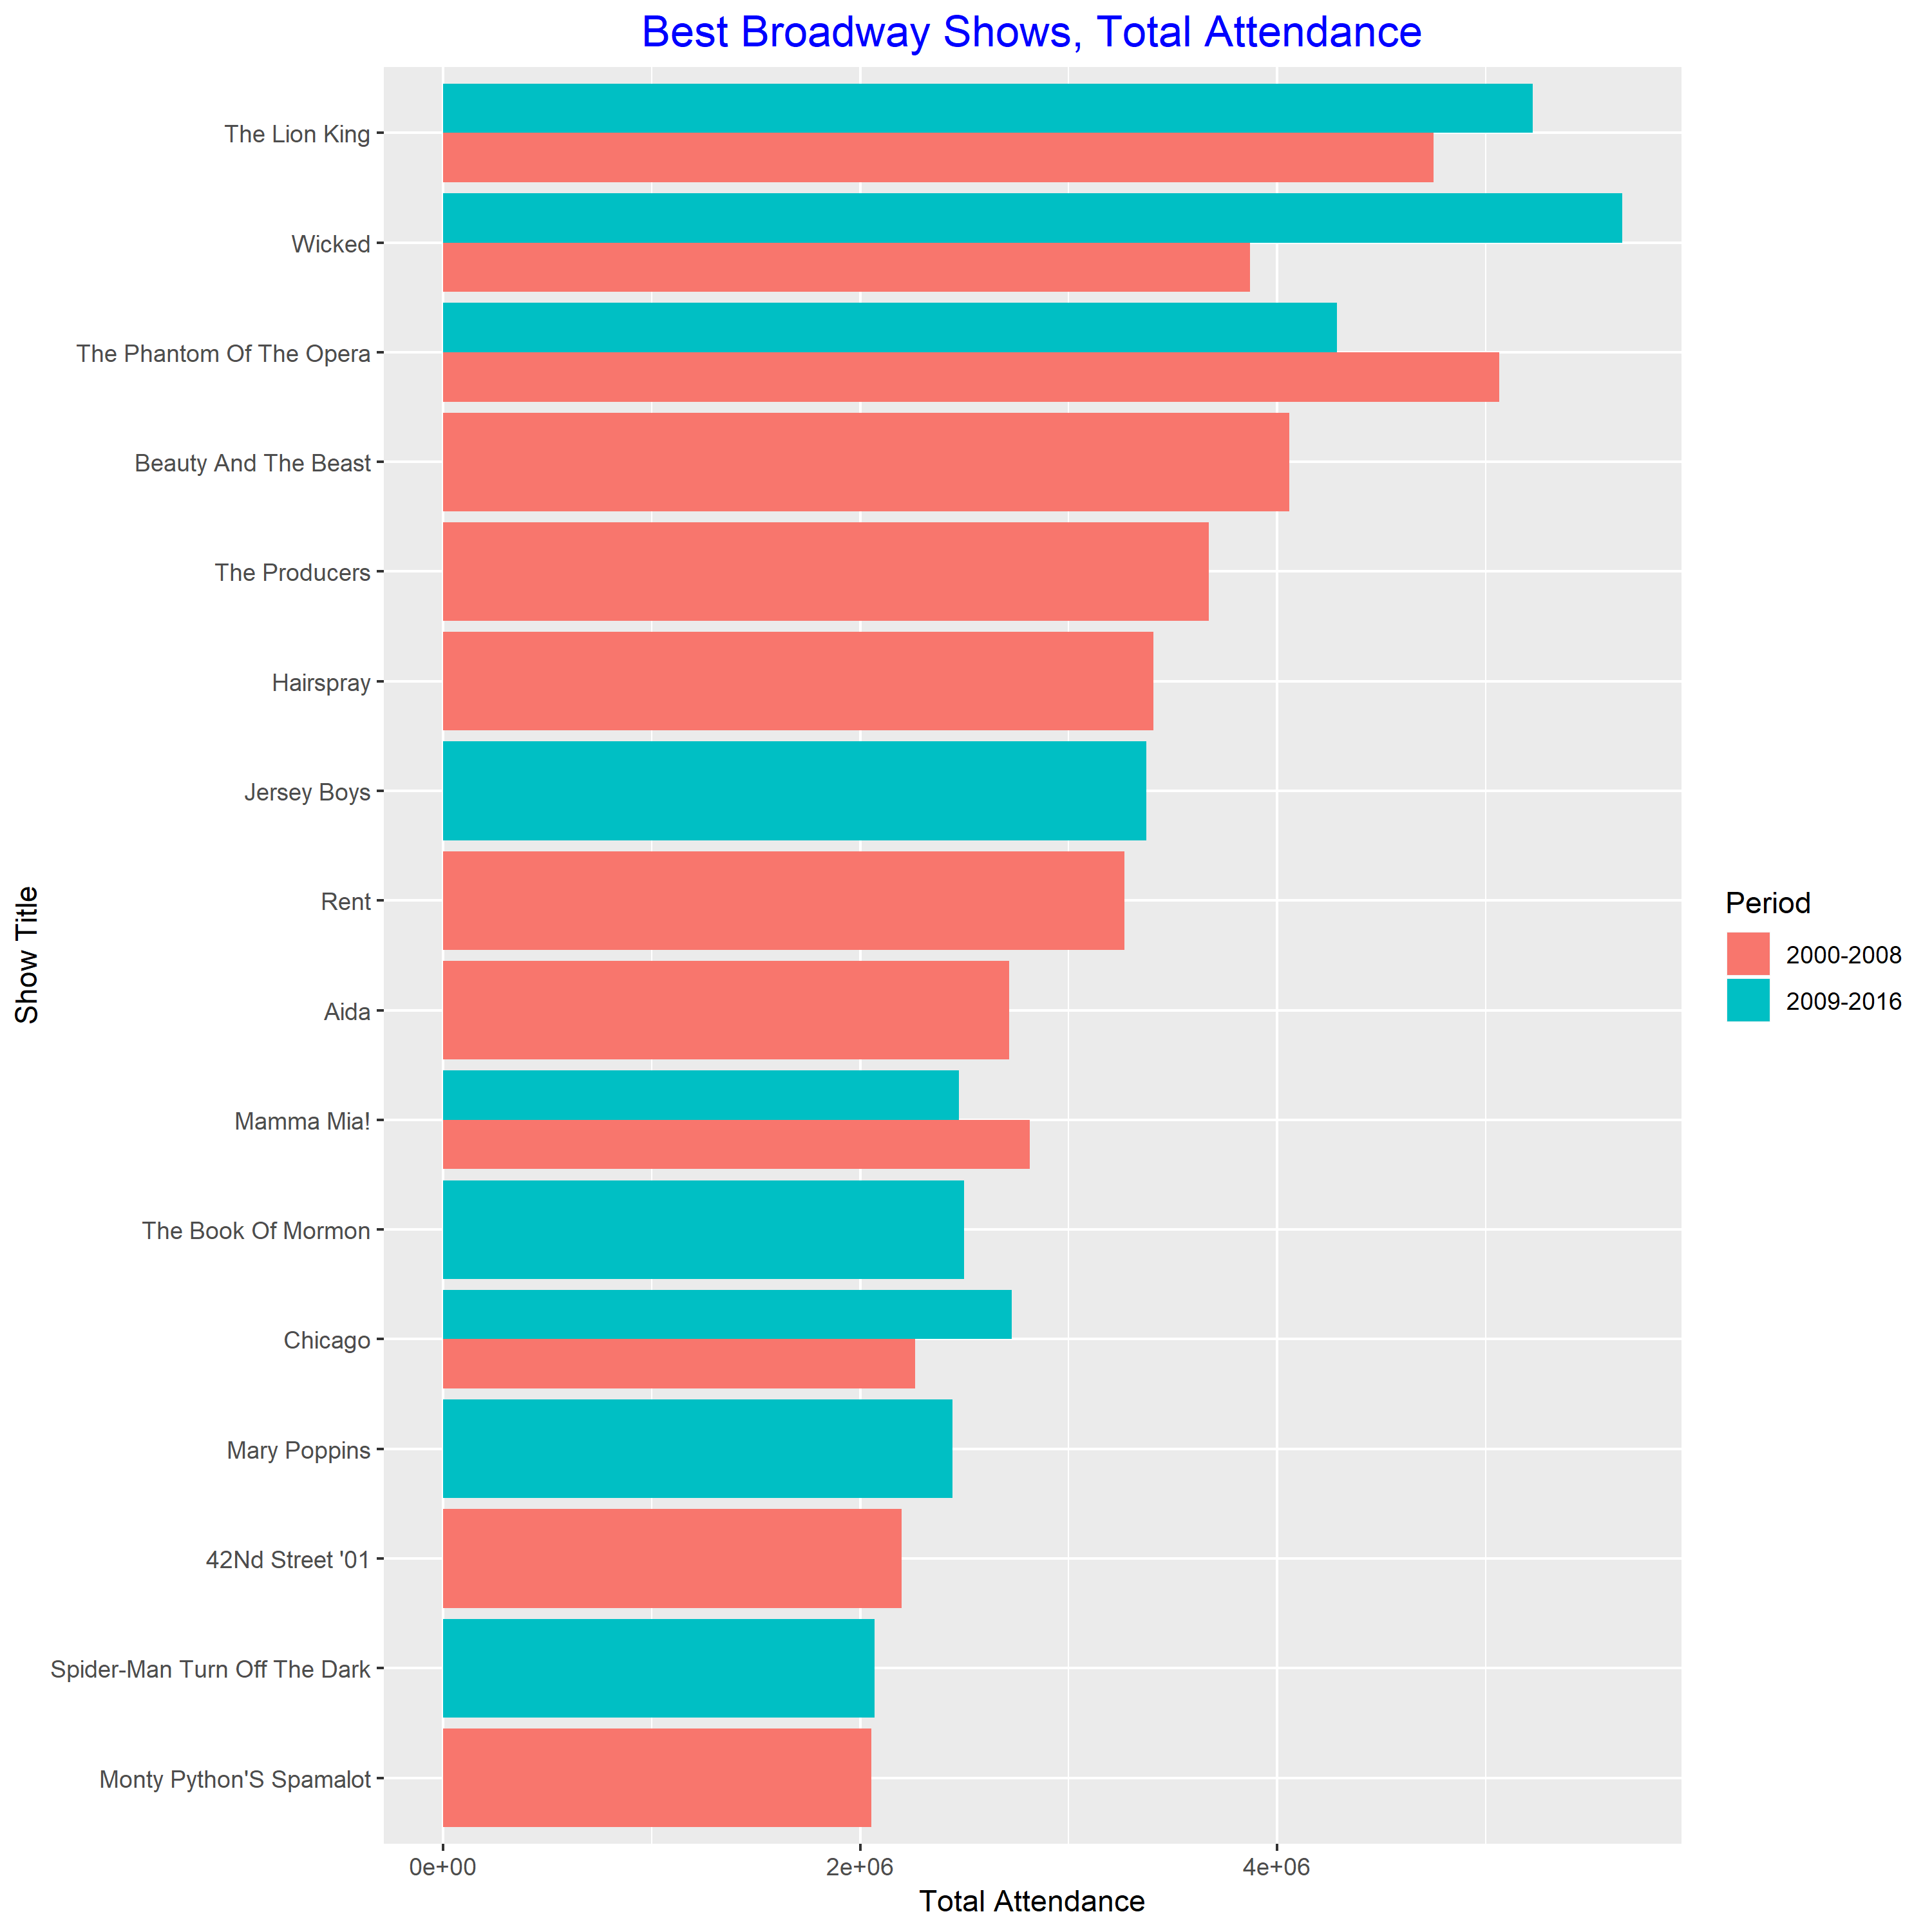
The improved grouped bar plot

This plot is much easier to read than the previous one. From this plot, we know the best show in 2000-2008 is “The Phantom of the Opera”. The best show in 2009-2016 is “Wicked”. And both of them are very popular during 2000-2016.