This dataset UScereal involves the nutritional information for a selection of US cereals.
Part I
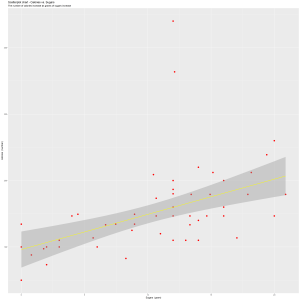
Good display
Bad display

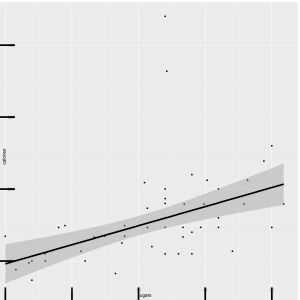
The modified graph violate the following elementary principles of graph, which make the modified graph has unclear vision.
1.do not allow data labels in the interior of the scale-line rectangle to interfere with the quantitative data or to clutter the graph.
Some points are obscured by the tick marks and the regression line.
2.tick marks should point outward.
The tick marks all point inward and obscure the data inside the scale-line rectangle.
Part II
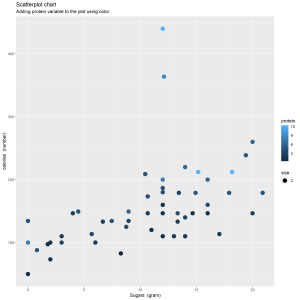
In the new graph, I use color to add protein variable in the graph. I delete the regression line in order to make the data stand out and avoid superfluity. And I change the size of the plotting symbols to prevent being overlooked.
From the new scatter plot, I observe that higher protein contains higher calories for one portion. The cereal has higher protein could contain higher sugars.